Credit: NASA, public domain, Via Wikimedia Commons
Since the peak of the last Ice Age, Earth’s ice has been melting, and sea level has risen nearly 400 feet! But only recently do we have the technology to carefully measure it.
For the last 20 years, a network of satellites and nearly 4,000 robotic floats have been measuring temperature and surface elevation of the global oceans.
They’ve found that the surface of the ocean has warmed an average of 1 degree Fahrenheit in that time, and average global sea level has risen 3.5 inches.
While this is within the normal rate of sea level rise for the past 8,000 years, we can now better understand what’s happening:
Warming seas have contributed to the melting of ice sheets in Antarctica and glaciers in Greenland. Their meltwater is responsible for about 2.3 inches of that sea level rise.
But the other 1.2 inches comes from a property of water itself. Water expands as it warms because molecules bump up against each other more frequently, causing an increase in volume.
Meaning that, as oceans have warmed, they’ve swollen in their basins and slowly crept onto the land.
Oceans act as heat sinks to moderate global temperatures swings, and researchers estimate they have absorbed 90 percent of the warming that Earth has experienced over these past 20 years.
As our planet and oceans continue to warm, there will be more sea level rise, not just from more meltwater, but further swelling of the sea.
Background
Synopsis: Earth’s oceans absorb heat from the atmosphere, safeguarding the planet from extreme temperature fluctuations. But there is a catch. Since 1993, satellite radar altimetry has recorded increasing sea surface height over most of the globe, with global mean sea level rising a total 3.5 in (8.89 cm), an average of 3.4 mm/yr. While much of this annual rate can be attributed to the melting of land-based glacial ice, an astounding one-third of the rise is attributed to thermal expansion of ocean water as it warms.
- Earth’s oceans cover 71% of its surface (ED-001 Precious Water), making it the “Blue Planet,” but our global seas have a much more important role. The oceans make Earth’s climate more stable for life by buffering planetary temperature fluctuations, principally because of the high heat capacity of water.
- Heat capacity is the amount of heat required to raise one gram of material 1°C under constant pressure.
- Because of extensive hydrogen bonding between its molecules, water has the highest heat capacity of all common earth materials.
- About 35% of heat energy absorbed by water is required to break hydrogen bonds, leaving only 65% to warm the water by increasing its kinetic energy.
- To raise the temperature of water by 1°C, it takes 4 times more energy than to warm air, 5 times more than sand, and 10 times more than copper. That’s why, when beach sand gets hot on a sunny day, you can walk in wet sand or seawater and it is still cool enough for your feet, and conversely it explains why metal becomes so hot to the touch in the sun.
- Since water requires so much energy to heat, the oceans change temperature very slowly, safeguarding the planet from extreme temperature fluctuations.
- A variety of scientific satellites orbit Earth each day, measuring changes to our atmosphere, cryosphere and hydrosphere.
- Researchers from NASA, NOAA and other organizations monitor Earth’s surface by remotely sensing physical properties from space.
- Earthbound counterparts to these satellites may relay their data to satellites for real-time transmission to researchers.
- Global sea surface temperature is monitored by a number of international satellites calibrated to ocean-based probes, provided as maps and combined into a mean value.
- The NOAA/NASA Suomi NPP and NOAA-20 satellite missions carry the Visible Infrared Imaging Radiometer Suite (VIIRS) of instruments that capture both visible and infrared data, including sea surface temperature.
- In the last 20 years, global mean sea surface temperature has increased about 1°F (0.6°C) compared to the average from 1971 to 2000.
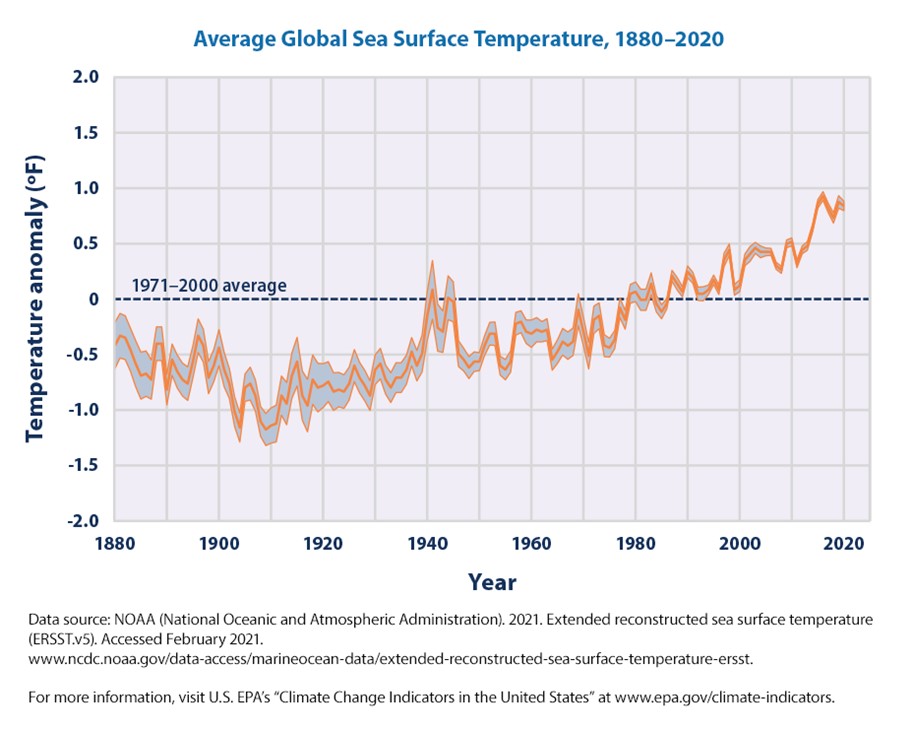
Average surface temperature of the world’s oceans since 1880.
Credit: EPA from NOAA data - Researchers estimate Earth’s oceans have absorbed about 90% of the heat trapped in Earth’s atmosphere.
- Satellite radar altimetry also monitors another of Earth’s important changes—global sea level rise, similarly portrayed in map form and combined into a mean value.
- Global mean sea level (GMSL) is the area weighted mean height of the ocean’s surface. The variation in this value is used to quantify sea level change.
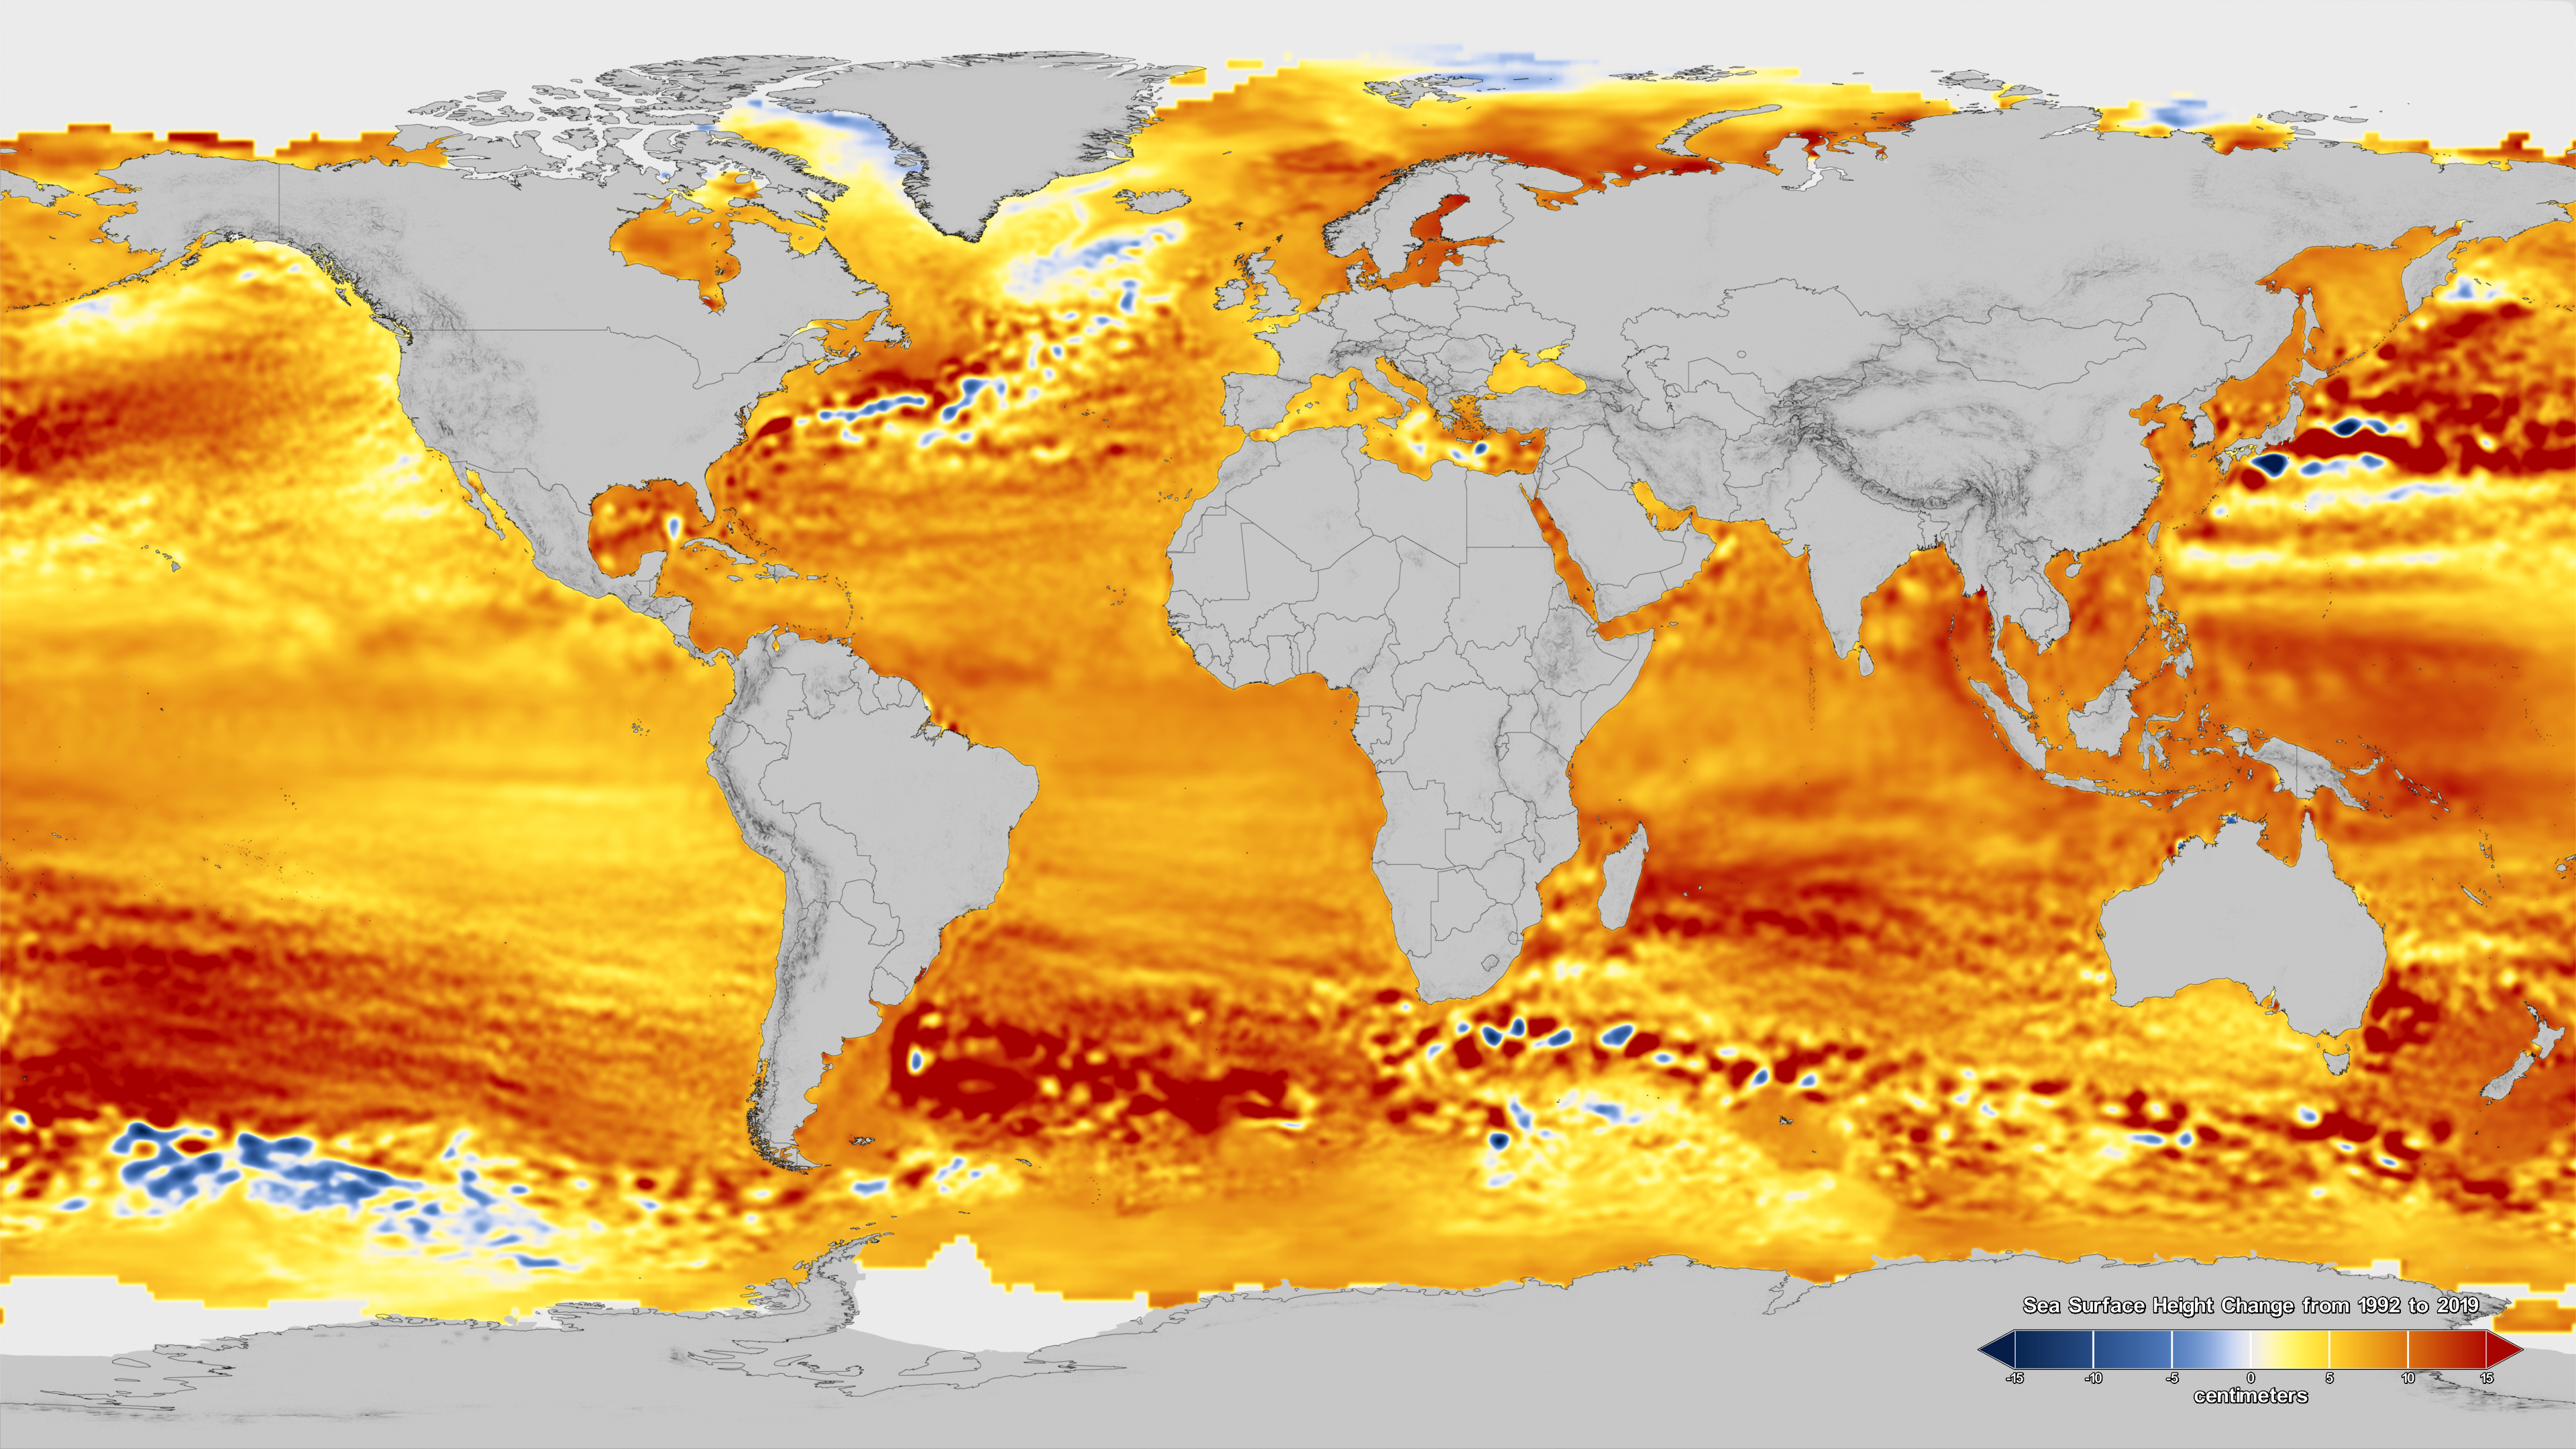
Since 1993, satellite altimeter radar measurements have tracked the sea surface height across our ever-changing oceans. This map shows 1993 to 2019 change. Darkest red represents 6 inches (15 centimeters) of sea level rise, crossing through white for zero change to the darkest blue of 6 inches (15 centimeters) of measured sea level drop.
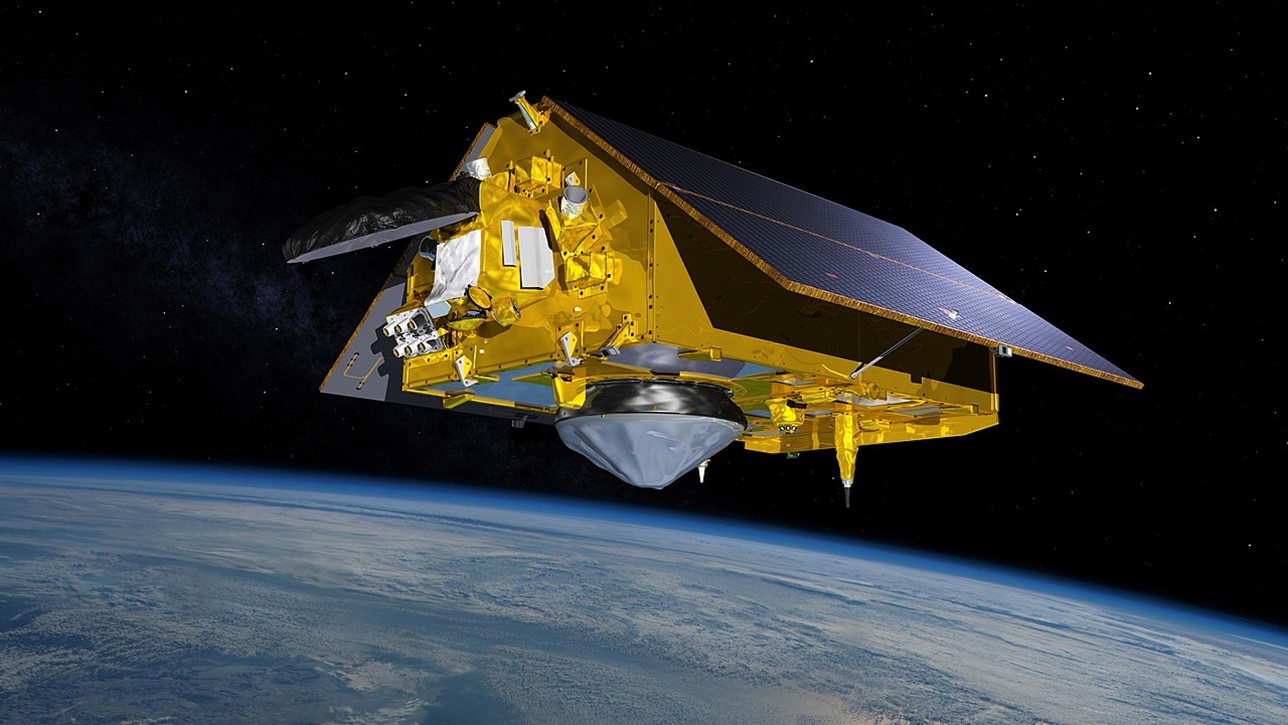
Credit: NASA - In 1992, the TOPEX/Poseidon mission was the first to record satellite radar altimetry measurements of sea surface height.
- The Jason program started in 2001, including Jason-1 from 2001–2013, Jason-2 from 2008–2019, Jason-3 from 2016, and Sentinal-6 Michael Freilich from 2020.
- Jason program satellites circle Earth every 10 days to estimate global mean sea level with an uncertainty of just 3 to 4 mm, tied in to a global network of drifting sensors and incorporating ship-based measurements.
- From 1993 to 2020, these instruments recorded an increase in GMSL of 88.9 mm (3.5 in), an average rate of 3.4 mm/yr (just over 1/8th of an inch per year).
- Global mean sea level (GMSL) is the area weighted mean height of the ocean’s surface. The variation in this value is used to quantify sea level change.
- There are two components to global mean sea level rise: added water volume from the melting of land-based ice and the thermal expansion of warming seawater.
- About two-thirds of the increase is attributed to melting glaciers and ice sheets, with continuous mass measurements from the twin GRACE satellites from 2002 to 2017 and the twin GRACE-Follow-On satellites since 2018 (ED-022 Measuring Gravity from Space).
- The remaining one-third of sea level rise has been attributed to thermal expansion of seawater in the upper ocean.
- Like most substances, when water warms and its kinetic energy increases, it expands. For H2O, this occurs above 39.2°F (4°C).
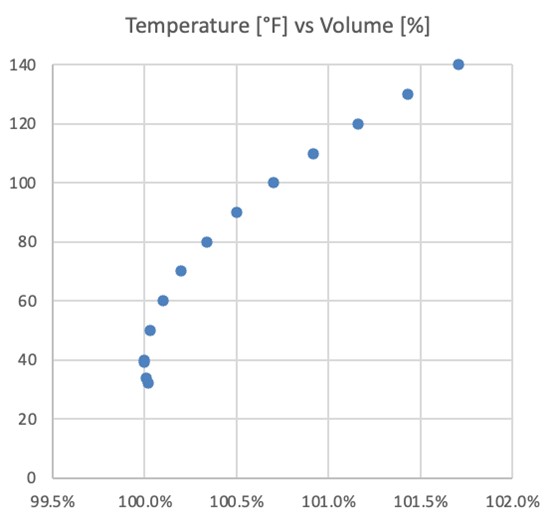
Thermal expansion of fresh water with temperature increase.
Credit: Data from Engineering Toolbox - More than 3,800 free-drifting robotic Argo profiling floats measure the temperature and salinity of the upper 6,562 ft (2,000 m) of Earth’s oceans, bobbing to the surface every few weeks to relay their data via satellite linkups.
- These floats have documented about 1.3 mm of what is known as steric sea level rise per year, attributed to increasing sea temperature and salinity.
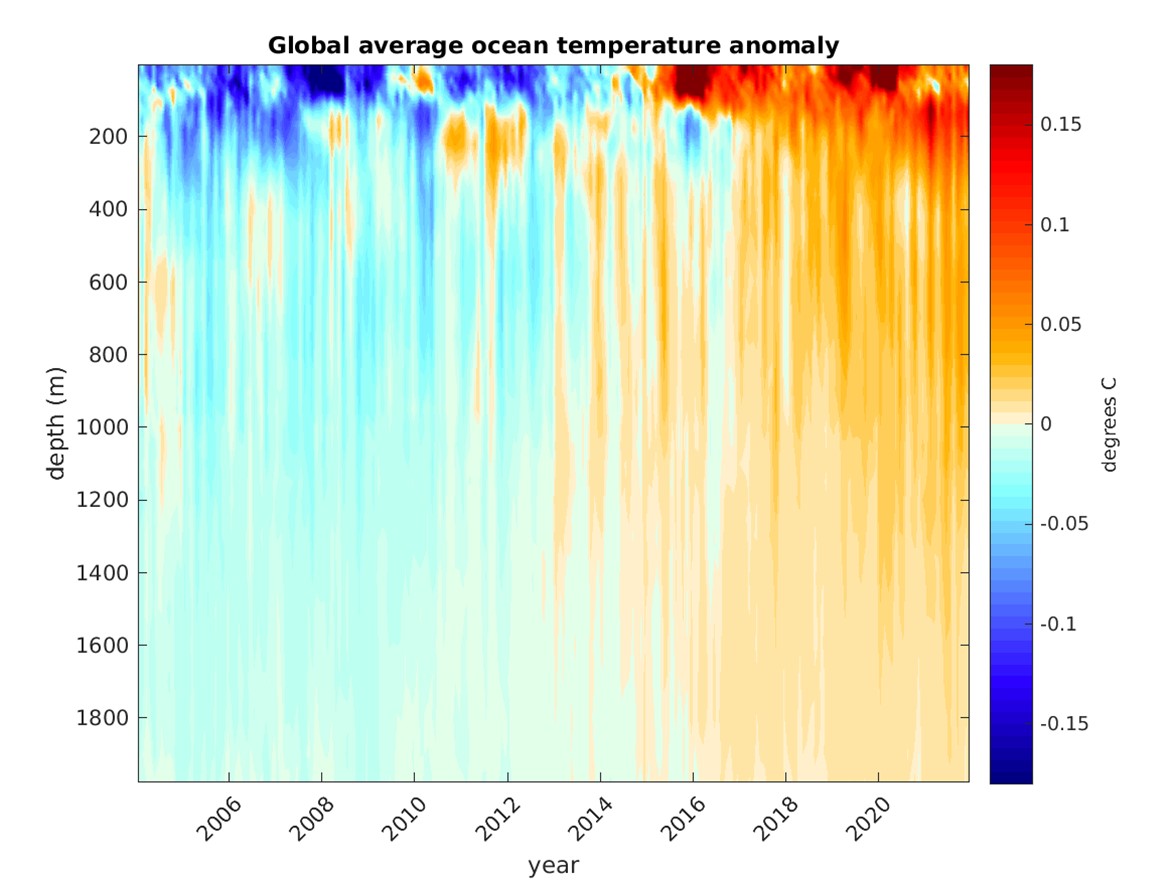
This figure shows temperature anomalies averaged over the global ocean, down to 1,900 meters, since 2004, measured by Argo. While temperatures in the upper ~600 meters fluctuate with shorter-term climate events like El Niño–Southern Oscillation, deeper waters display a consistent warming trend.
Credit: Argo
- Measurements and calculations from three different satellite and ocean-based profiling programs balance, further supporting the conclusions.
- Adding the GRACE and GRACE-FO measurements for melting ice water volume to the Argo calculations for thermal expansion of water produces a curve that closely overlies the change in global mean sea level curve from the radar altimetry of the Jason program.
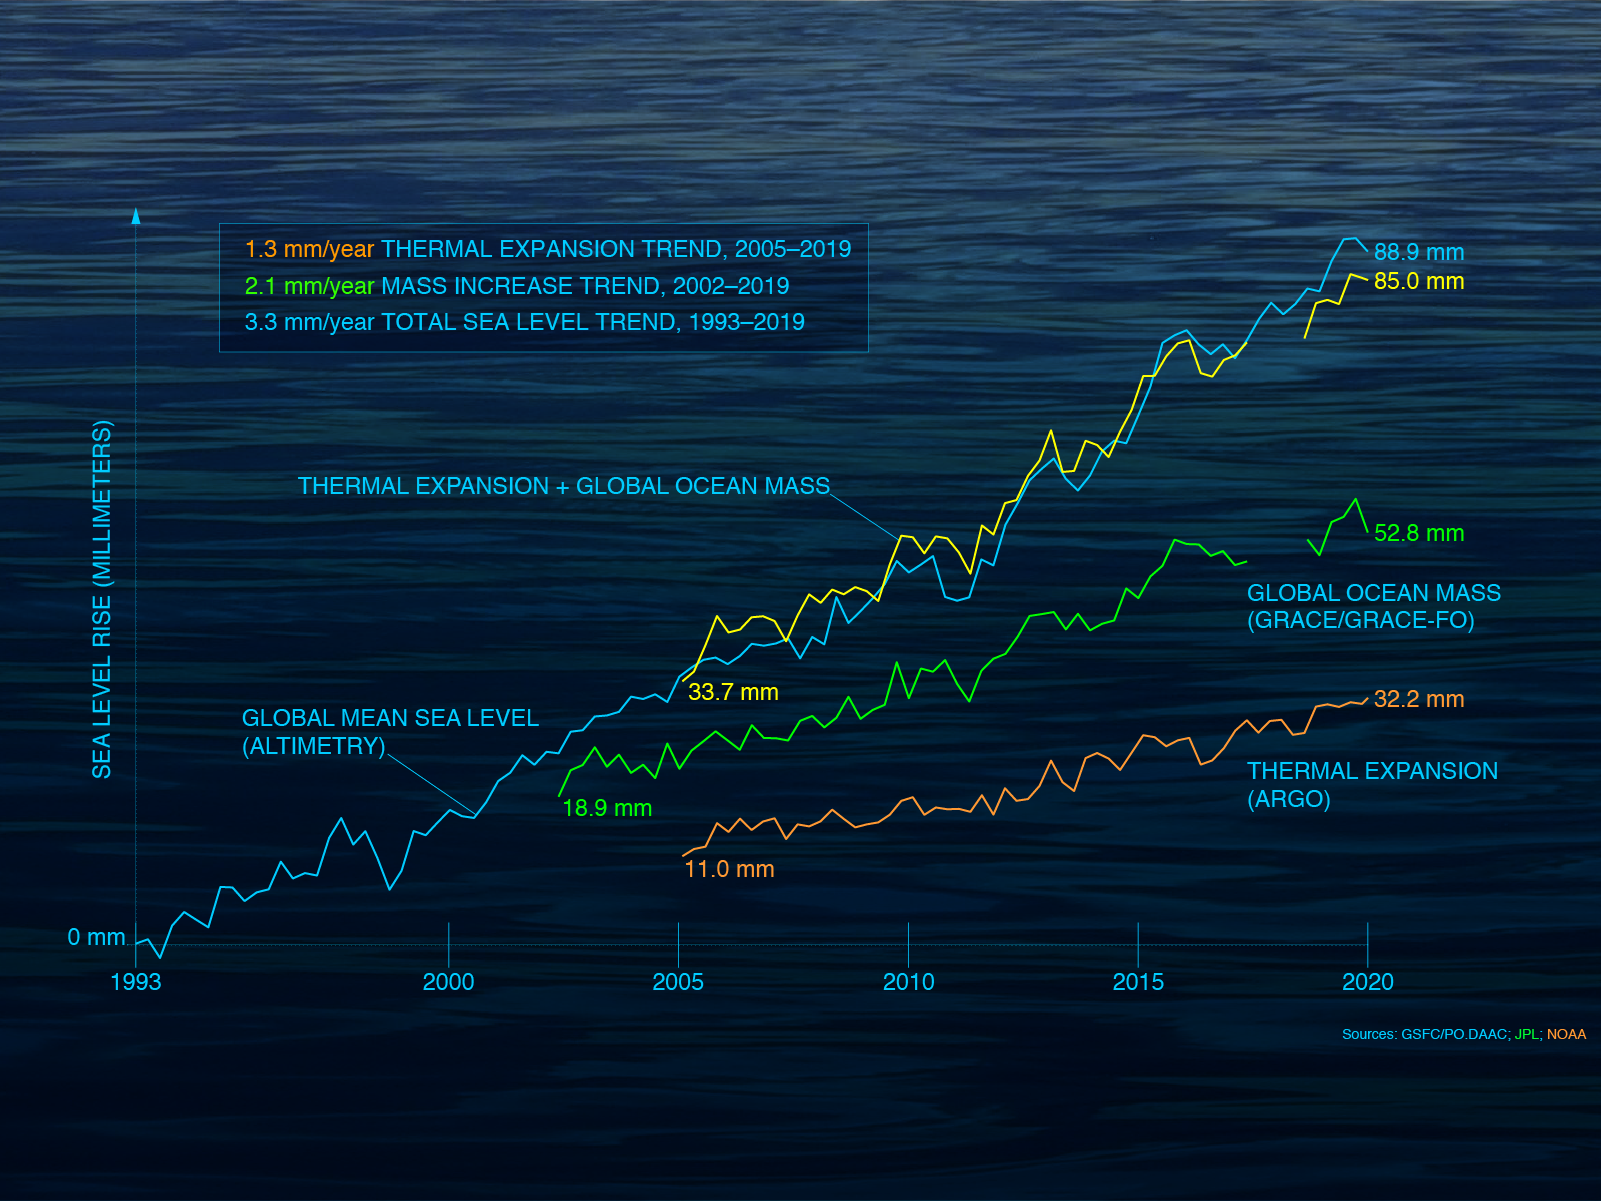
From 1993 to 2020, global mean sea level rise measured by altimetry in the blue curve totaled 3.5 inches (8.89 centimeters). The green curve shows sea level rise related to the melting of glaciers and ice sheets as measured by the GRACE and GRACE-FO satellites. Sea level rise from thermal expansion alone is shown by the orange curve and has been measured at about 1.3 millimeters a year by the Argo system of vertical profiling floats. The yellow curve is the sum of the orange and green curves, roughly overlying the blue altimetry measurements to show the sea level change budget is just about balanced between these two causes.
Credit: NASA
- Adding the GRACE and GRACE-FO measurements for melting ice water volume to the Argo calculations for thermal expansion of water produces a curve that closely overlies the change in global mean sea level curve from the radar altimetry of the Jason program.