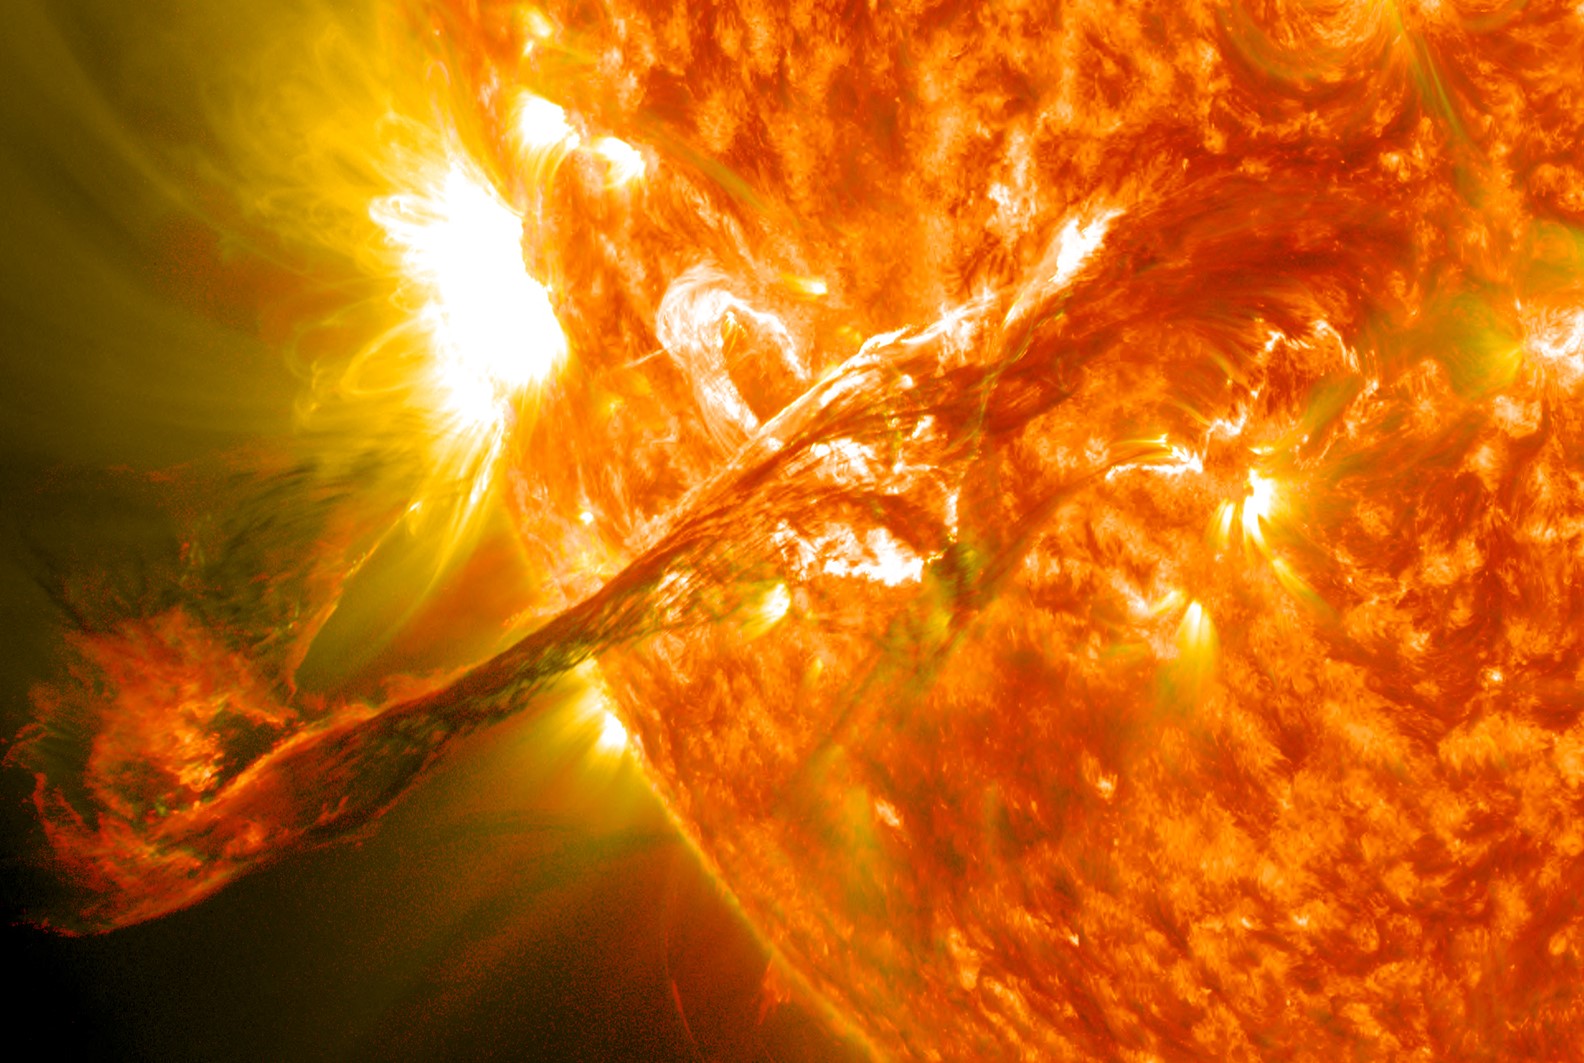
Credit: NASA Goddard Space Flight Center, CC BY 2.0, via Wikimedia Commons
Millions of miles from Earth, the fastest object that humans have ever built is circling the Sun at 430,000 miles per hour, and nearer than any spacecraft has ever dared go.
It’s the Parker space probe, and NASA sent it there in 2018 with a mission: to study solar activity. That’s because, in 2024, the Sun is predicted to reach its next solar maximum.
It happens when the Sun’s poles flip and its magnetic fields go “crazy.” This produces coronal mass ejections—burning gas that erupts into the Sun’s atmosphere, sending waves of electromagnetic energy toward Earth. This is often called “solar weather.”
In 1921, a solar maximum disrupted our nascent electric grid, as we described in another EarthDate. Now, a hundred years later, our electrical networks are vast and more vital—both on Earth and in our atmosphere, where thousands of satellites orbit.
Normally, a solar maximum occurs every 11 years or so, but this one’s coming sooner than expected, which has governments and companies rushing to prepare our technology to avoid the worst problems.
But we still may see errors and slowing of GPS, interrupted satellite internet and communications, and reduced cellular coverage.
Meanwhile, the Parker probe will track the Sun’s activity through the solar maximum and for years beyond to help us weather … the solar weather.
Background
Synopsis: Our solar weather forecast shifts from “quiet” to “stormy with sunspots likely” to “quiet” again about every 11 years. Recently, scientists determined that the next solar maximum is coming on faster and stronger than expected. It has the potential to amplify danger to critical infrastructure, both in space and on Earth.
- Earth’s Sun has a natural cycle that occurs about every 11 years (ranging from 7 to 14 years) as its magnetic poles flip.
- The solar cycle both starts and ends with solar minima, when the Sun is calm.
- The cycle peaks with a solar maximum as the Sun's magnetic field lines get tangled up, causing more sunspot activity, solar flares, and coronal mass ejections (CMEs). Solar irradiance output grows by about 0.07%.
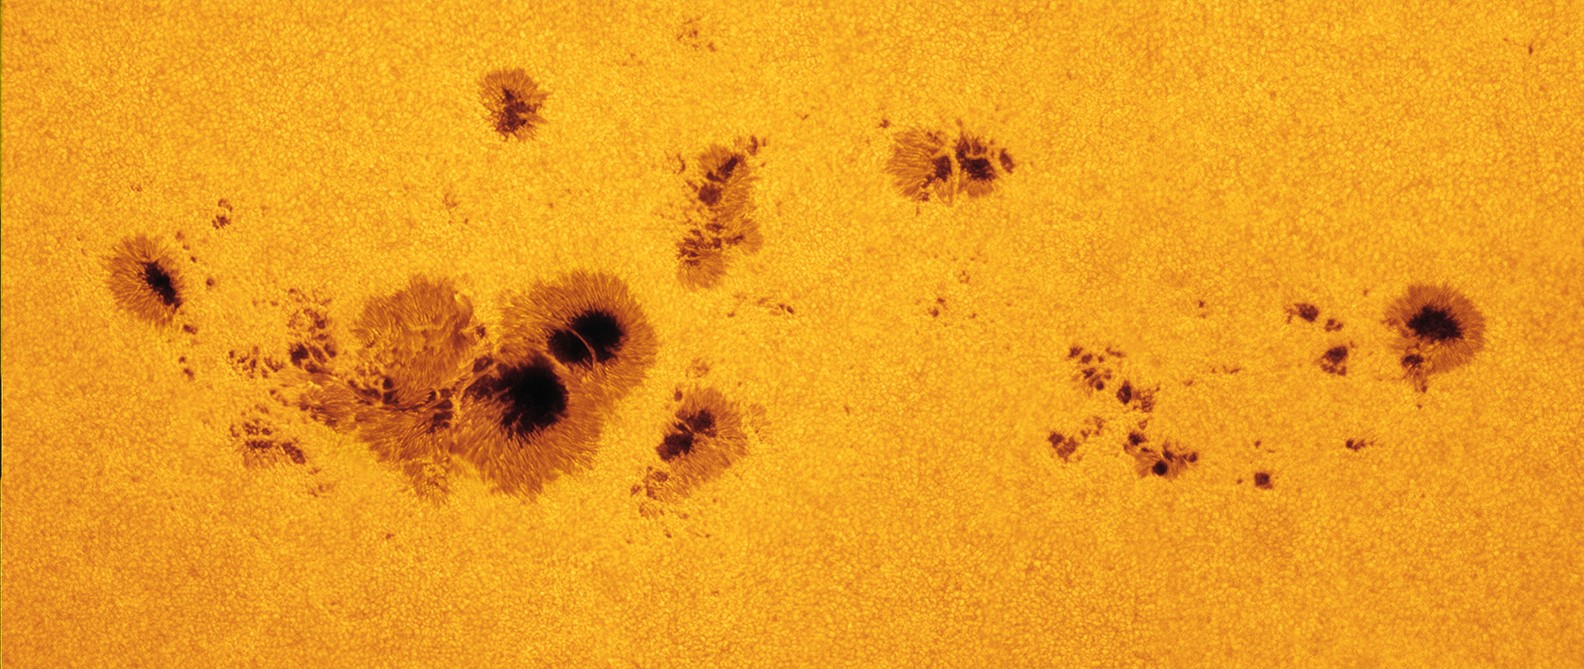
A group of sunspots labeled as Active Region 1520 rotated into view over the left side of the Sun (from Earth perspective) on July 7, 2012. The large spot on the bottom left stretches more than 11 Earth diameters, or 87,000 miles (140,000 kilometers), across. The full chain of spots is closer to 25 Earth diameters, 200,000 miles (321,000 kilometers) across. This image was captured by amateur astronomer Alan Friedman on July 10.
Credit: NASA Goddard Space Flight Center from Greenbelt, MD, USA, public domain, via Wikimedia Commons - A complete magnetic field cycle takes around 22 years for the magnetic pole to flip, then return to its starting orientation. This is called a Hale cycle.
- Solar magnetic cycles have been discussed in a previous EarthDate episode, ED-126 Two Sides of the Sun.
- Sunspot activity has been documented using solar telescopes since 1749. Since 1755, 24 11-year solar cycles have been noted. The 25th is currently underway.
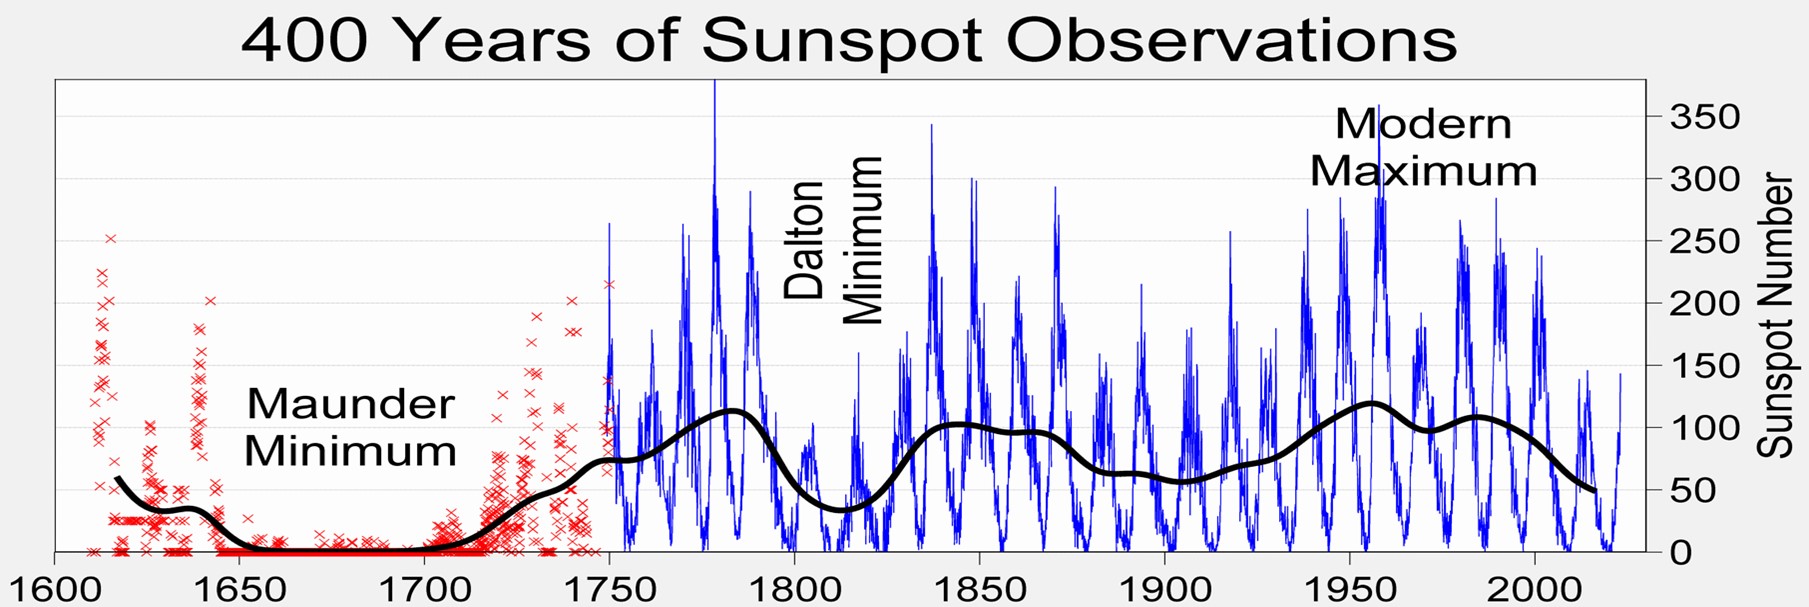
This figure from February 2023 is a compilation of sunspot activity over 400 years. Sunspots have been counted monthly since 1749 (blue and purple) and were recorded in global scientific literature back to 1600 (red). The black line is the smoothed maximum sunspot number, a 13-month rolling average of longer-term variability in solar activity. The blue peaks illustrate the regular ~11-year solar cycles.
Credit: Robert A. Rhode, GFDL 1.2-or-later, via Wikimedia Commons- Longer-term variability through the historical records include periods of magnetic-cycle quiescence like the Dalton Minimum in the 1800s and the Maunder Minimum from 1645 to 1715, which may have contributed to global cooling during the Little Ice Age.
- A previous EarthDate episode describes the hazards of geomagnetic storms (ED-011 Magnetic Storms).
- Another EarthDate episode tells the story of a solar magnetic superstorm that occurred in 1921 that blasted CMEs toward Earth for three days in May, spiking voltages on telegraph lines that burst into fires and pushing the auroras known as the northern lights as far south as Texas (ED-211 Solar Superstorm).
- Modern infrastructure is even more vulnerable to CMEs, so predicting the onset of solar activity is a big priority for both the government and corporations.
- Our Sun is unpredictable, so scientists look at historical patterns, starting with the recent past.
- The previous cycle that peaked from 2011 to 2015, Solar Cycle 24, was unusual. Cycle 24 sunspots started in the Sun’s northern hemisphere and peaked two years before sunspots in the southern hemisphere peaked. This “out of phase” development spread the total number of sunspots across time compared to a situation with the hemispheres “in phase.”
- Solar Cycle 24 is thought of as a weaker cycle because it had a lower number of sunspots on average, with a 13-month rolling average smoothed maximum sunspot number (SSN) of 116, compared to Cycles 23, 22 and 21, with SSNs of 180, 213 and 233, respectively. Historically, the SSN average is 178.
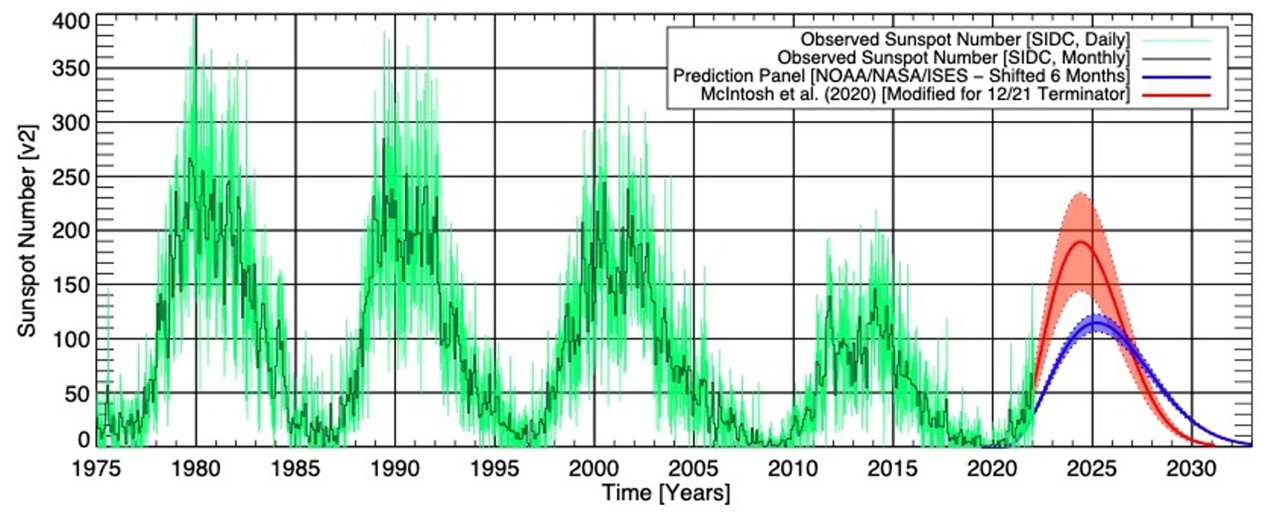
Green lines show detail of observed sunspots per month since 1975. Blue lines show the original NASA and NOAA prediction, while red lines show a 2020 prediction by NCAR suggesting Cycle 25 will start earlier and will exhibit more intense activity than expected.
Credit: NASA
- Some scientists have even noted a downward trend in cycle intensity since 1980.
- NOAA scientists predicted Solar Cycle 25 would be mild, similar to Cycle 24. Its peak would be in July 2025, with an SSN of 115.
- But in 2020, scientists at the National Center for Atmospheric Research (NCAR) used historical 22-year Hale magnetic cycles to predict that the solar cycle would peak sooner, by mid-2024, and be more intense (SSN of 184) than its predecessor.
- Solar Cycle 25 officially began in December 2019, and by July 2023 it had surpassed 159 sunspots.
- In November of 2023, NOAA’s Space Weather Prediction Center (SWPC) revised their predictions as the actual data showed solar activity ramping up above the error bars for the original prediction.
- The new prediction is between the previous two estimates in timing and intensity.
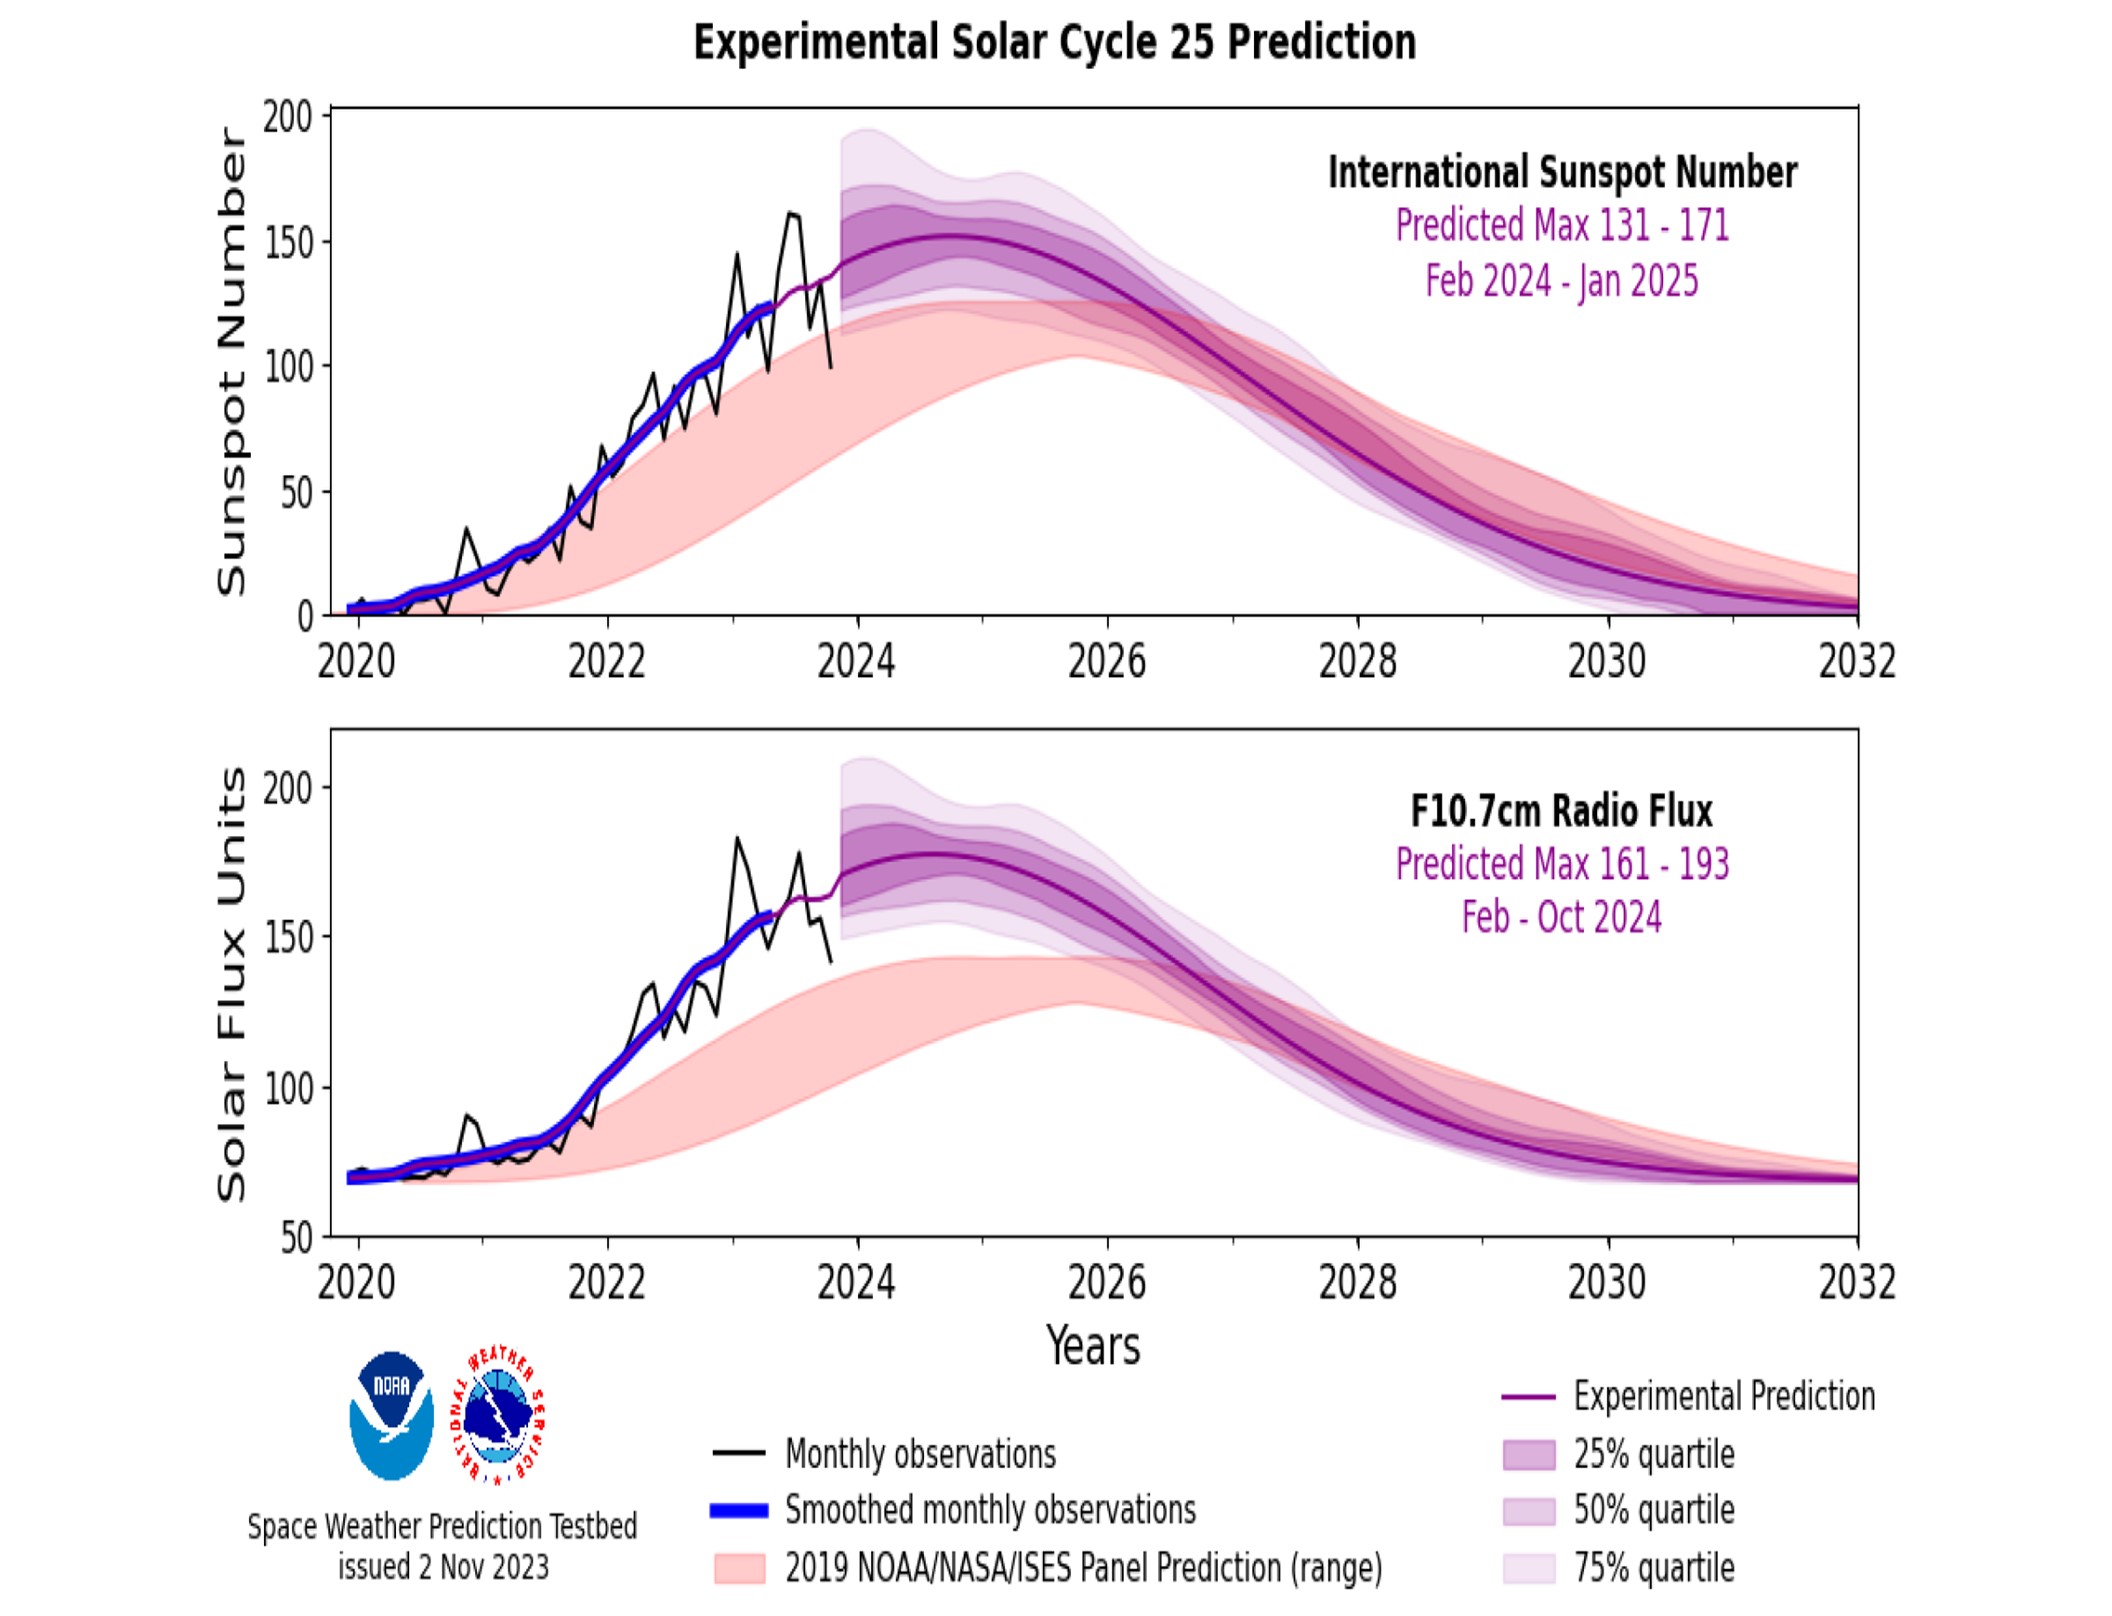
These graphs show NOAA's Space Weather Prediction Center's revised Solar Cycle 25 prediction as of November 2, 2023. Daily sunspot counts and radio flux measurements are compiled into a monthly average and graphed as a function of time, as indicated by the black line in the top figure. The blue line is a smoothed version of the this observed sunspot number, obtained by applying a 13-month average to each point in the black curve.
Credit: NOAA
- The new prediction is between the previous two estimates in timing and intensity.
- Predicting the timing and intensity of solar activity, or space weather, is important to modern civilization because so much of our infrastructure is vulnerable to the solar flares and CMEs that are more frequent and intense during solar maxima.
- Predictions regarding the possible strength of Solar Cycle 25 are particularly important because many newer stakeholders and technologies were not even around to navigate the previous mild solar maximum about a decade ago.
- Everyday activities, like navigation and communication, depend on space-based technologies that didn’t exist in 1921 during Earth’s last solar superstorm.
- During solar storms, errors may occur in GPS positioning over entire regions because of variations in plasma density in the ionosphere.
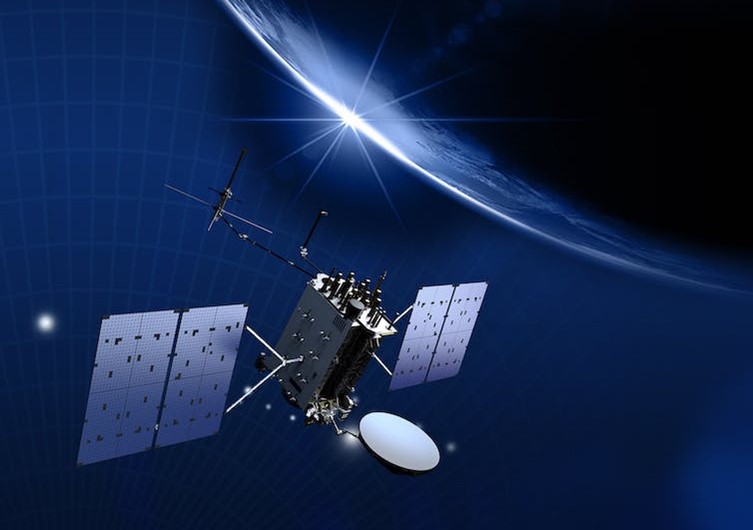
Solar activity can cause location errors when using GPS devices. The Global Positioning System (GPS) is a constellation of orbiting satellites that provides position, navigation and timing data to military and civilian users globally. The system is operated and controlled by Space Delta 8, a U.S. Space Force unit located at Schriever Space Force Base, Colorado.
Credit: Lockheed Martin and U.S. Space Force, public domain - Global communications that depend on space-to-surface transmissions may degrade, including those that underpin military operations, the internet, mobile phones in remote areas and financial transactions ranging from the stock market to your neighborhood ATM.
- During solar storms, errors may occur in GPS positioning over entire regions because of variations in plasma density in the ionosphere.
- In addition to the International Space Station, more than 35,000 objects orbit in Earth’s ionosphere–thermosphere region. All are vulnerable to space weather.
- Variable atmospheric heating may increase satellite drag, destabilizing orbits and increasing wear and tear.
- This may result in shifting of satellites out of their optimal working positions, decreased satellite lifespans and increased risk of collisions and early atmospheric reentry of both satellites and space debris.
- Our interconnected and interdependent global infrastructure, including power grids and pipelines, is vulnerable to geomagnetically induced currents that may damage or destroy them.
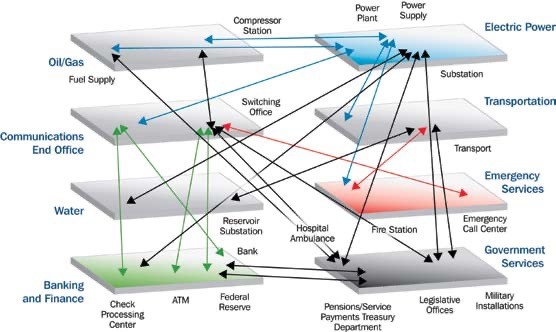
Connections and interdependencies across the economy. Schematic showing interconnected infrastructures and their qualitative dependencies and interdependencies.
Credit: U.S. Department of Homeland Security, National Infrastructure Protection Plan - The high flux of radiation from energetic particles emitted during geomagnetic storms tends to push auroras toward the equator, exposing a larger proportion of airplane and space travelers to increased radiation risks.
- With so much at stake, governments around the world carefully monitor heliophysics, the connected Sun–Earth system, using dedicated experts and equipment:
- The Parker Solar Probe, launched in 2018, is the fastest object ever built by humans. At its closest approach in 2025, it will be moving at 430,000 mph (690,000 km/h), which is more than 625,000 fps (191 km/s), 0.064% of the speed of light. This spacecraft has a goal of observing the outer corona of the Sun, approaching within 4.3 million miles from the center of the Sun. It flew through the Sun’s corona in 2021 and will monitor solar physics for Cycle 25.
- The Space Weather Prediction Center (SWPC) is jointly operated by NOAA and the U.S. Air Force in Boulder, Colorado, and provides real-time monitoring of the solar–terrestrial environment and conducts research in heliophysics. It is the national and world warning center for space weather disturbances that can threaten people and equipment in space.
- The Solar Terrestrial Relations Observatory (STEREO) was a pair of identical satellites launched by NASA into solar orbit in 2006 designed to provide a stereoscopic view of things like CMEs. One of the two disappeared in 2014, but the other is still operational.
- The Solar Dynamics Observatory (SDO) was launched in February 2010 by NASA to observe the Sun as part of the “Living With a Star” program which is designed to understand the influence of the Sun on Earth and near-Earth space.
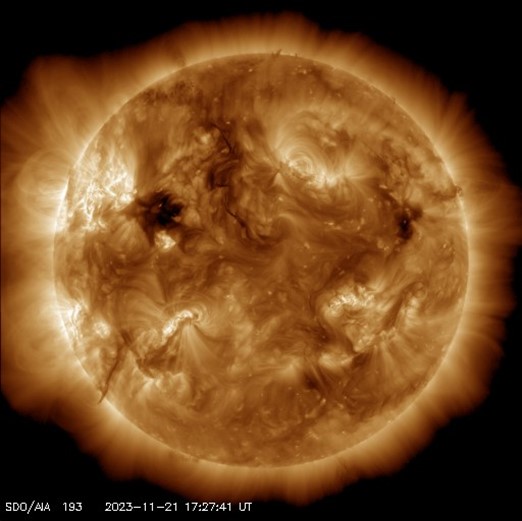
A Solar Dynamics Observatory image of the Sun in November 2023. You can see live images of our Sun every day at the Solar Dynamics Observatory website.
Credit: NASA's Solar Dynamics Observatory - The Solar Orbiter launched as a joint mission between NASA and the European Space Agency (ESA) in 2020 to study the Sun’s poles and the solar wind and is still operational and watching for Cycle 25 effects.
- Toward the end of Solar Cycle 25, in 2027 or later, NASA’s Heliophysics Division will launch a mission called the Geospace Dynamics Constellation (GDC) to study the ionosphere–thermosphere region about 215 to 250 mi (346–402 km) above Earth. It will be operational during Solar Cycle 26 to aid our understanding of the Sun as well as its interaction with Earth’s atmosphere.