Credit: NOAA Science on a Sphere
Think of Earth as a rubber ball. If you push in at one place, the surface will indent. Surrounding that indentation, the ball will bulge outward.
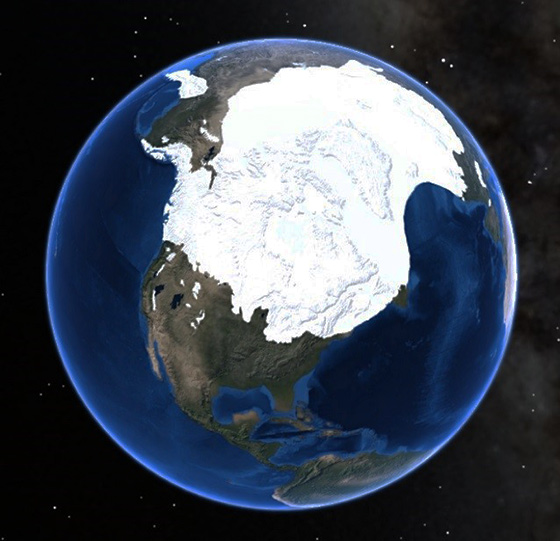
Near the end of the last Ice Age, just 20,000 years ago, continental ice sheets covered 25 percent of Earth’s landmass, pushing down on Earth’s surface with as much as 150 tons per square foot of pressure.
This depressed the surface and pushed up the land around the perimeter.
During the last 15,000 years, the Ice Age ended and glaciers have naturally retreated to cover only 11 percent of the land surface today.
And just like a rubber ball, the Earth’s surface has been rebounding—very slowly.
Areas that were depressed by ice are rising. Canada, Scotland, and Scandinavia all have risen 4 to 6 inches over the past century.
Areas that had bulged outward at the edge of glaciers are now sinking, back to pre–Ice Age levels, around 4 inches per century.
This can be seen in southern England and Ireland and the northern and middle U.S., including many cities like Chicago, Milwaukee, and Cleveland.
In low-lying near-coastal cities like London and Washington, D.C., falling land levels combined with rising seas from continued glacial melt are making those cities more prone to flooding.
We can expect rising and falling landmasses, and associated shoreline changes, as Earth continues its slow motion Ice Age rebound.
Background
Synopsis: At a human scale, Earth’s surface may seem completely stable, but in places it is moving in relentless slow motion, still recovering from the effects of Pleistocene glaciation. The land surface around Lake Michigan and the British Isles is tilting southward, Chesapeake Bay is subsiding, and some Canadian and Scandinavian regions are rising—all at a scale of just millimeters per year, which adds up over centuries.
- In the 1700s, Swedes noticed that sea level seemed to be dropping in their coastal bays. Anders Celsius (of temperature-scale fame) investigated, marking rocks at locations all along the coastline. Successive markings over the years demonstrated that water levels were dropping, but not at the same rate. It turned out that land levels were rising more in some places than others!
- In 1865, Scottish scientist Thomas Jamieson theorized that land was rising differentially in Europe because of the retreat of Ice Age glaciers. Swedish geologist Baron Gerard De Geer confirmed the theory in 1890 through his study of annual deposits in lakes.
- Today, researchers can track rising land using thousands of GPS stations deployed to monitor minute changes—as small as 1 mm—in the 3D locations of Earth’s surface.
Credit: Erik Ivins, JPL (public domain)
- Earth’s surface is very dynamic because its lithospheric plates are a very thin—only 3 percent of Earth’s radius—solid veneer floating on a viscoelastic mantle.
- Loading Earth’s surface with weight such as thick layers of ice causes it to bow downward, somewhat like pressing your finger into a rubber ball.
- To compensate for flexing downward, a ball’s surface bulges slightly upward adjacent to the depression, before blending into the undistorted spherical shape away from the indentation.
- Unloading the weight enables Earth’s surface to “rebound” to its previous shape. The first response is elastic—the surface bounces back. The second response is viscous as the mantle flows in to eventually restore equilibrium.
- For Earth, these responses take place over tens of thousands of years.
- During the Pleistocene Epoch, multiple glaciations advanced and retreated over Earth’s surface for more than 2 million years.
- Continental glaciation reached its maximum extent about 20,000–25,000 years ago, with 25 percent of Earth’s land surface covered in ice sheets over a mile thick.
- This glaciation loaded Earth’s lithosphere to more than 150 tons per sq ft over much of North America, Europe, and Asia, depressing it as much as 1300 ft (400 m).
- The great weight displaced mantle material from beneath the ice sheets toward their edges, causing the land surface beyond the ice sheets to bulge upward. Geologists call this a forebulge.
- The glaciers melted and retreated rapidly for about 15,000 years until the start of the Holocene 11,700 years ago, when ice sheets stabilized somewhat. Today, ice sheets cover about 11 percent of Earth’s landmasses.
- From a geologic standpoint, the melting of the Pleistocene glaciers happened very recently and Earth’s surface rebounded rapidly upward, as fast as mantle material could move in to replenish the former depressions.
- This glacial isostatic rebound is still underway today. Since the mantle is so viscous, it may take another 10,000 years for it to fully reclaim the material stored in the forebulges.
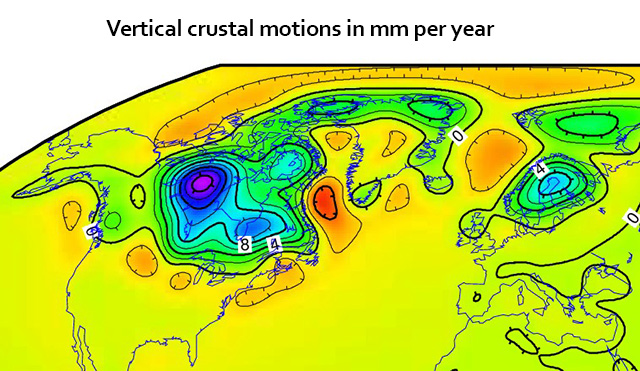
Vertical crustal motions in mm/yr (cm/decade) from a 2007 model. Blue and purple areas up to +18 mm indicate rising due to the removal of the weight of ice sheets. Yellow and red areas down to -6 mm indicate subsidence as mantle material moves away from these areas to supply rising areas and deflates forebulges peripheral to the maximum extent of the ice sheets.
Credit: Erik Ivins, JPL (public domain)
- Civilization flourished in the wake of the glacial retreat, and humans became accustomed to occupying these imperceptibly deflating forebulges. Some important population centers and shorelines are sinking or rising because of lingering Pleistocene effects.
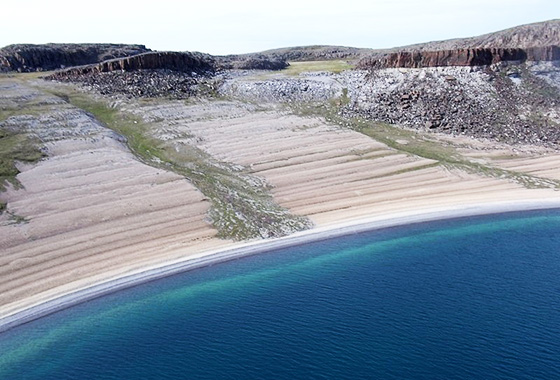
- Northern Canada and Scandinavia: These regions are rising, and the changes can be quite tangible—both where Anders Celsius first made marks in the rocks of Scandinavian coastal ports in the 1700s and in the natural geologic markings visible on Canadian beaches along the Arctic Ocean, sometimes even connecting islands to the coast.
This beautifully layered sand beach in northernmost Canada is being created by centuries of glacial rebound of the Arctic Ocean coastline, raising the land surface progressively. Little to no tide occurs in these waters. Isostatic rebound is still underway and may continue for another 10,000 years.

- Chesapeake Bay: Since the 1960s, tidal gauges have demonstrated that sea level in the Chesapeake Bay area is rising twice as fast as the global rate.
- To better understand the Pleistocene history of the estuary, researchers drilled 70 core holes up to 100 ft (30 m) deep in and around Maryland’s Blackwater National Wildlife Refuge on the eastern shore of Chesapeake Bay, just 60 miles southeast of Washington, D.C.
- Researchers created a 3D view that captured several million years of geologic changes, confirming that the Chesapeake Bay region—including Washington, D.C.—is subsiding about 6 inches (15 cm) per century.
- The U.S. Capitol Building has dropped more than 1 ft (30 cm) since the first session of Congress took place there in 1800. Subsidence is expected to continue at the same rate for at least the next century.