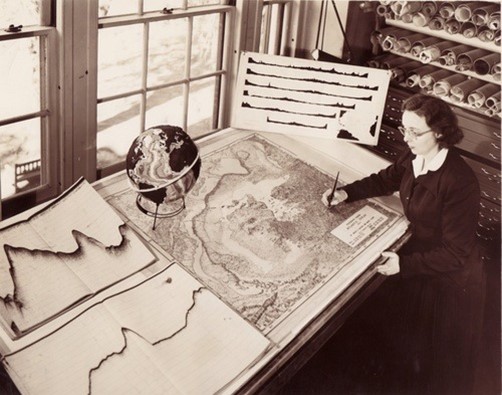
Credit: Lamont-Doherty Earth Observatory and the estate of Marie Tharp
Until Marie Tharp came along, no one knew what the seafloor really looked like.
It was long thought to be a featureless plain of mud.
Then sonar, invented in World War II, began to give us a glimpse. But it could only “read” the bottom of the ocean right below the ship’s path.
Marie Tharp earned master’s degrees in geology and mathematics in the 1940’s and joined the navy to study the seafloor—but women were not allowed on research ships.
Instead, she was assigned to process and analyze new sonar data from hundreds of voyages.
She soon discovered a deep rift valley in the Atlantic Ocean, which suggested the ocean floor was expanding. But other scientists rejected the idea.
By coincidence, Howard Foster, stationed at the next desk, was plotting undersea earthquake areas to avoid for a transatlantic cable. His fault zones lined up almost exactly with Tharp’s mid-Atlantic trench. They became convinced it was an active geological boundary.
But the concept of plate tectonics was then so controversial that Tharp was fired. Undaunted, she continued to work from home.
In the 1960’s, she and Dr. Bruce Heezen finally presented their combined data to the scientific community, displaying their new undersea topographic maps in spectacular color.
Their work convinced the naysayers and has changed the way that people view and understand global geology.
Background
Synopsis: Seventy years ago, most scientists believed the ocean floor was featureless and flat. Concealed by oceans, 71% of Earth’s topography is hidden. In the 1950’s, geologist Marie Tharp used sonar collected by her colleagues, and a lot of patience, to reveal that the seafloor had mountain ranges and deep canyons more extensive than those on land, documenting more than 40,000 miles of mid-oceanic ridge. While her colleagues argued about the origin of the remarkable discovery, she just kept mapping to produce the proverbial picture worth a thousand words.
- Marie Tharp was the daughter of a USDA soil surveyor and a schoolteacher born in Michigan in 1920. She enjoyed going along to help her father in the field.
- Her family moved so often to follow her father’s work that she attended around 20 schools before attending Ohio University, graduating with majors in English and music, as well as four minors, in 1943.
- As men rallied to serve in World War II after the December 1941 Pearl Harbor attack, many science programs opened their doors to women, including geology. Marie jumped at the chance to attend the University of Michigan, graduating with a master’s degree in geology in 1944.
- At the advice of a mentor, she acquired drafting skills that could be employed on geological projects, since her gender might prevent her from working on field-based projects typical for male geologists.
- She went to work for an oil company in Oklahoma; however, she was so disappointed in the mundane tasks she was assigned as a woman that she attended night school at Tulsa University to attain another master’s degree in mathematics in 1948.
- In 1948, she began working as a drafter on the Lamont geography project, led by Dr. Maurice Ewing at Columbia University’s Lamont Geological Laboratory. Today the lab is known as the Lamont-Doherty Earth Observatory.
- Although many scientists thought of the ocean floor as a boring, drab plain covered in mud from continental erosion, Ewing was skeptical.
- There were some hints that the seafloor might be more interesting than that from past expeditions.
- In 1854, based on soundings obtained by dropping cannonballs on ropes to the seafloor, the U.S. Navy’s Matthew Fontaine Maury published a map with a “plateau” in the middle of the North Atlantic.
- In 1870, data collected during the HMS Challenger expeditions suggested a broad rise in the Central Atlantic, and, in 1910, Sir John Murray and Johan Hjort made observations in a follow-up expedition, noting the presence of trenches and a prominent ridge in the middle of the Atlantic.
- Sonar (sound navigation and ranging) was developed during wartime for submarine and iceberg location and could detect the depth of the ocean floor beneath ship tracks.
- After the end of World War II in 1945, the technology was employed to learn more about Earth’s oceans.
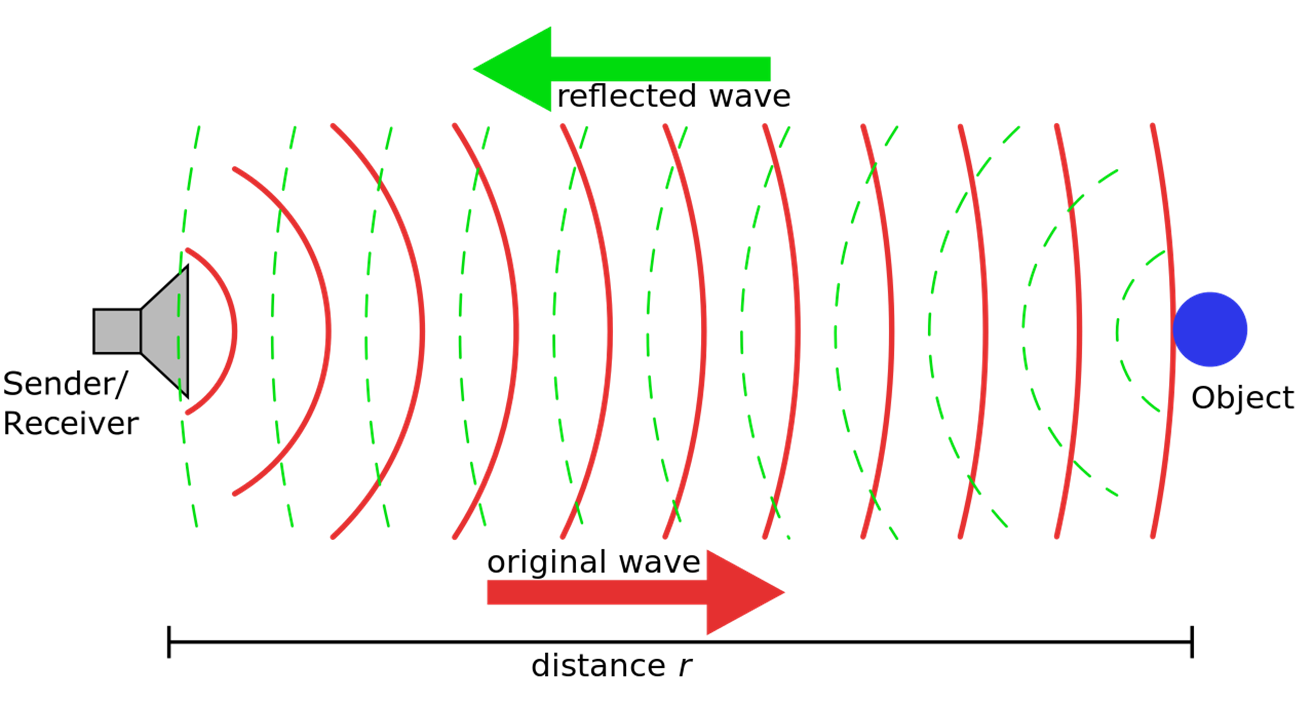
Sonar can be used to measure distance in water by sending pings that are reflected back. The longer it takes to detect the reflected ping the farther the object must be.
Credit: Georg Wiora (Dr. Schorsch), via Wikimedia Commons - Ewing hired a number of enthusiastic young scientists to gain a better view of ocean bathymetry using continuous sonar echo sounders he had helped develop for the navy.
- After the end of World War II in 1945, the technology was employed to learn more about Earth’s oceans.
- In the 1940’s, women were not allowed on working ships by the navy and other agencies largely because of superstition, so Marie was assigned to collate and synthesize data collected by male colleagues on numerous ocean expeditions.
- After a couple of years, a young scientist named Dr. Bruce Heezen kept her busy full time plotting ocean floor profiles from the North Atlantic, including searching for downed wartime aircraft for the government.
- Over several years, tens of thousands of depth measurements were collected and plotted by latitude and longitude at 1:1,000,000 scale, resulting in many 2D seafloor profiles along the ship tracks, as well as rough depth maps.
- To combine the 2D profiles into a 3D expression of the seafloor, in 1952, Marie organized her data into six somewhat parallel profiles across the North Atlantic and immediately noticed the similar geometry across each of these, with a characteristic V-shaped notch in the center. It was the idea of that continuous V-shaped gully that caused an uproar.
- Compared to terrestrial rift basins in East Africa, the shape of the notch suggested it might also be a rift valley, where lava emplacement pushes valley walls outward.
- In 1912, German scientist Alfred Wegener suggested that continents drift through the ocean floor based on the puzzle piece fit of several continents and the continuity of fossil assemblages across continents, among other lines of evidence.
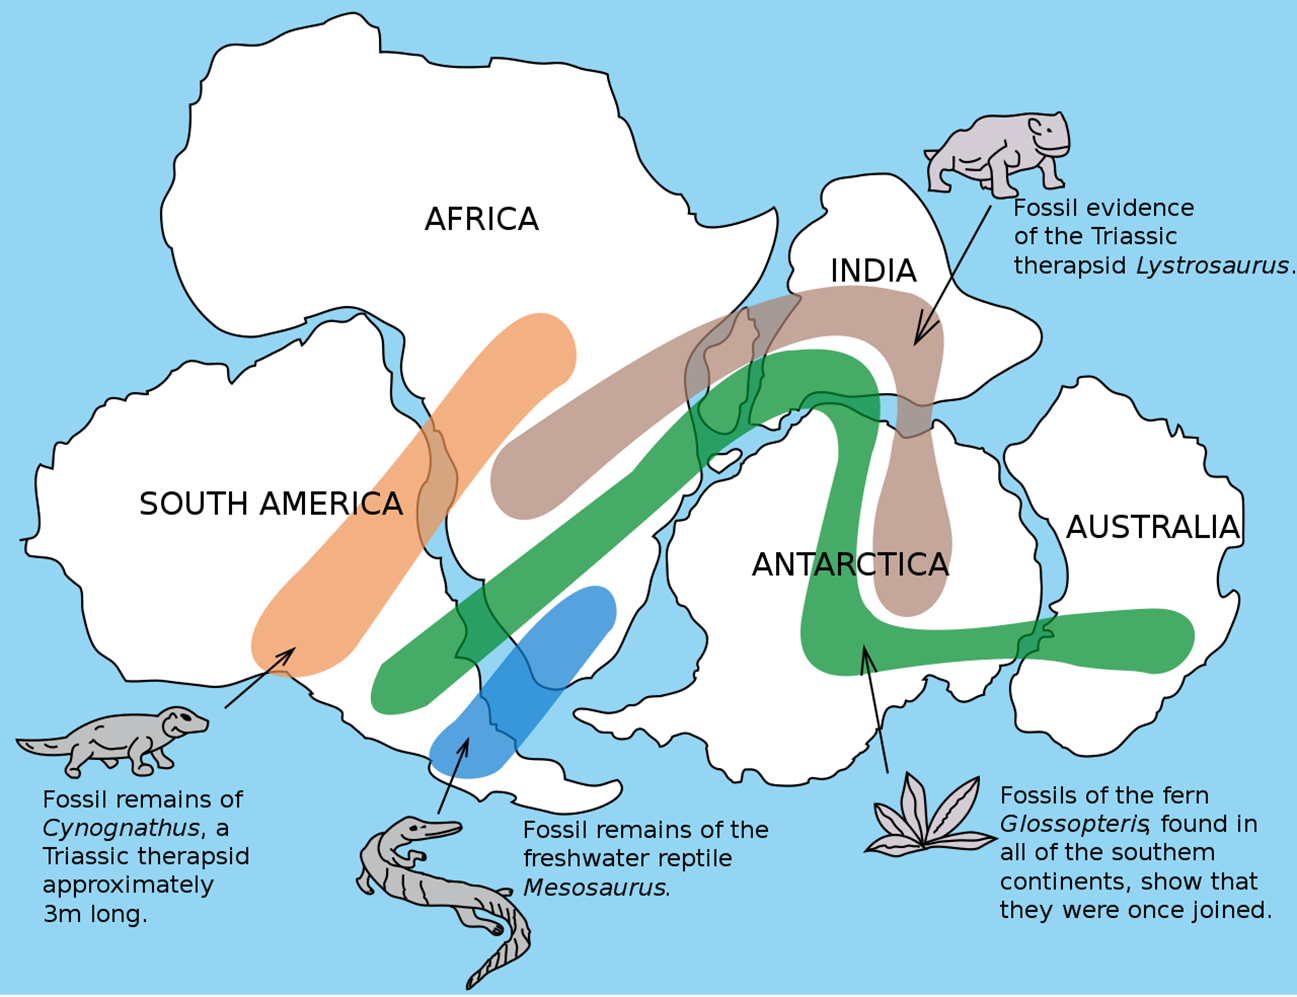
This fossil map illustrates Wegener’s ideas about the fit of the continents into Gondwana based on shape and fossil assemblages.
Credit: Osvaldocangaspadilla, public domain, via Wikimedia Commons - It was an idea before its time, and in the 1950’s many scientists still ridiculed the idea that continents could plow through the ocean floor.
- When Marie showed Bruce Heezen the data, he groaned, saying “It cannot be, it looks too much like continental drift,” calling her observations “girl talk.”
- Meanwhile, Bruce began another project with Dr. Ewing to locate earthquake regions to avoid in the routing of transatlantic communications cables, assisted by Howard Foster.
- As Marie mapped the world’s seafloor, Howard sat nearby and mapped earthquake epicenters at the same scale.
- That accidental proximity resulted in a surprise.
- They noticed that the clusters of earthquakes appeared to follow the same path as the V-shaped gully, which supported the idea that it was an active rift valley.
- The zone of Indian Ocean earthquakes was shown to continue into the East African Rift Valley, tying terrestrial observations to the seafloor.
- The mountainous ridge was shown to run for 40,350 mi through the world’s oceans, like the stitching on a baseball. ED-015 The Longest Mountain Range
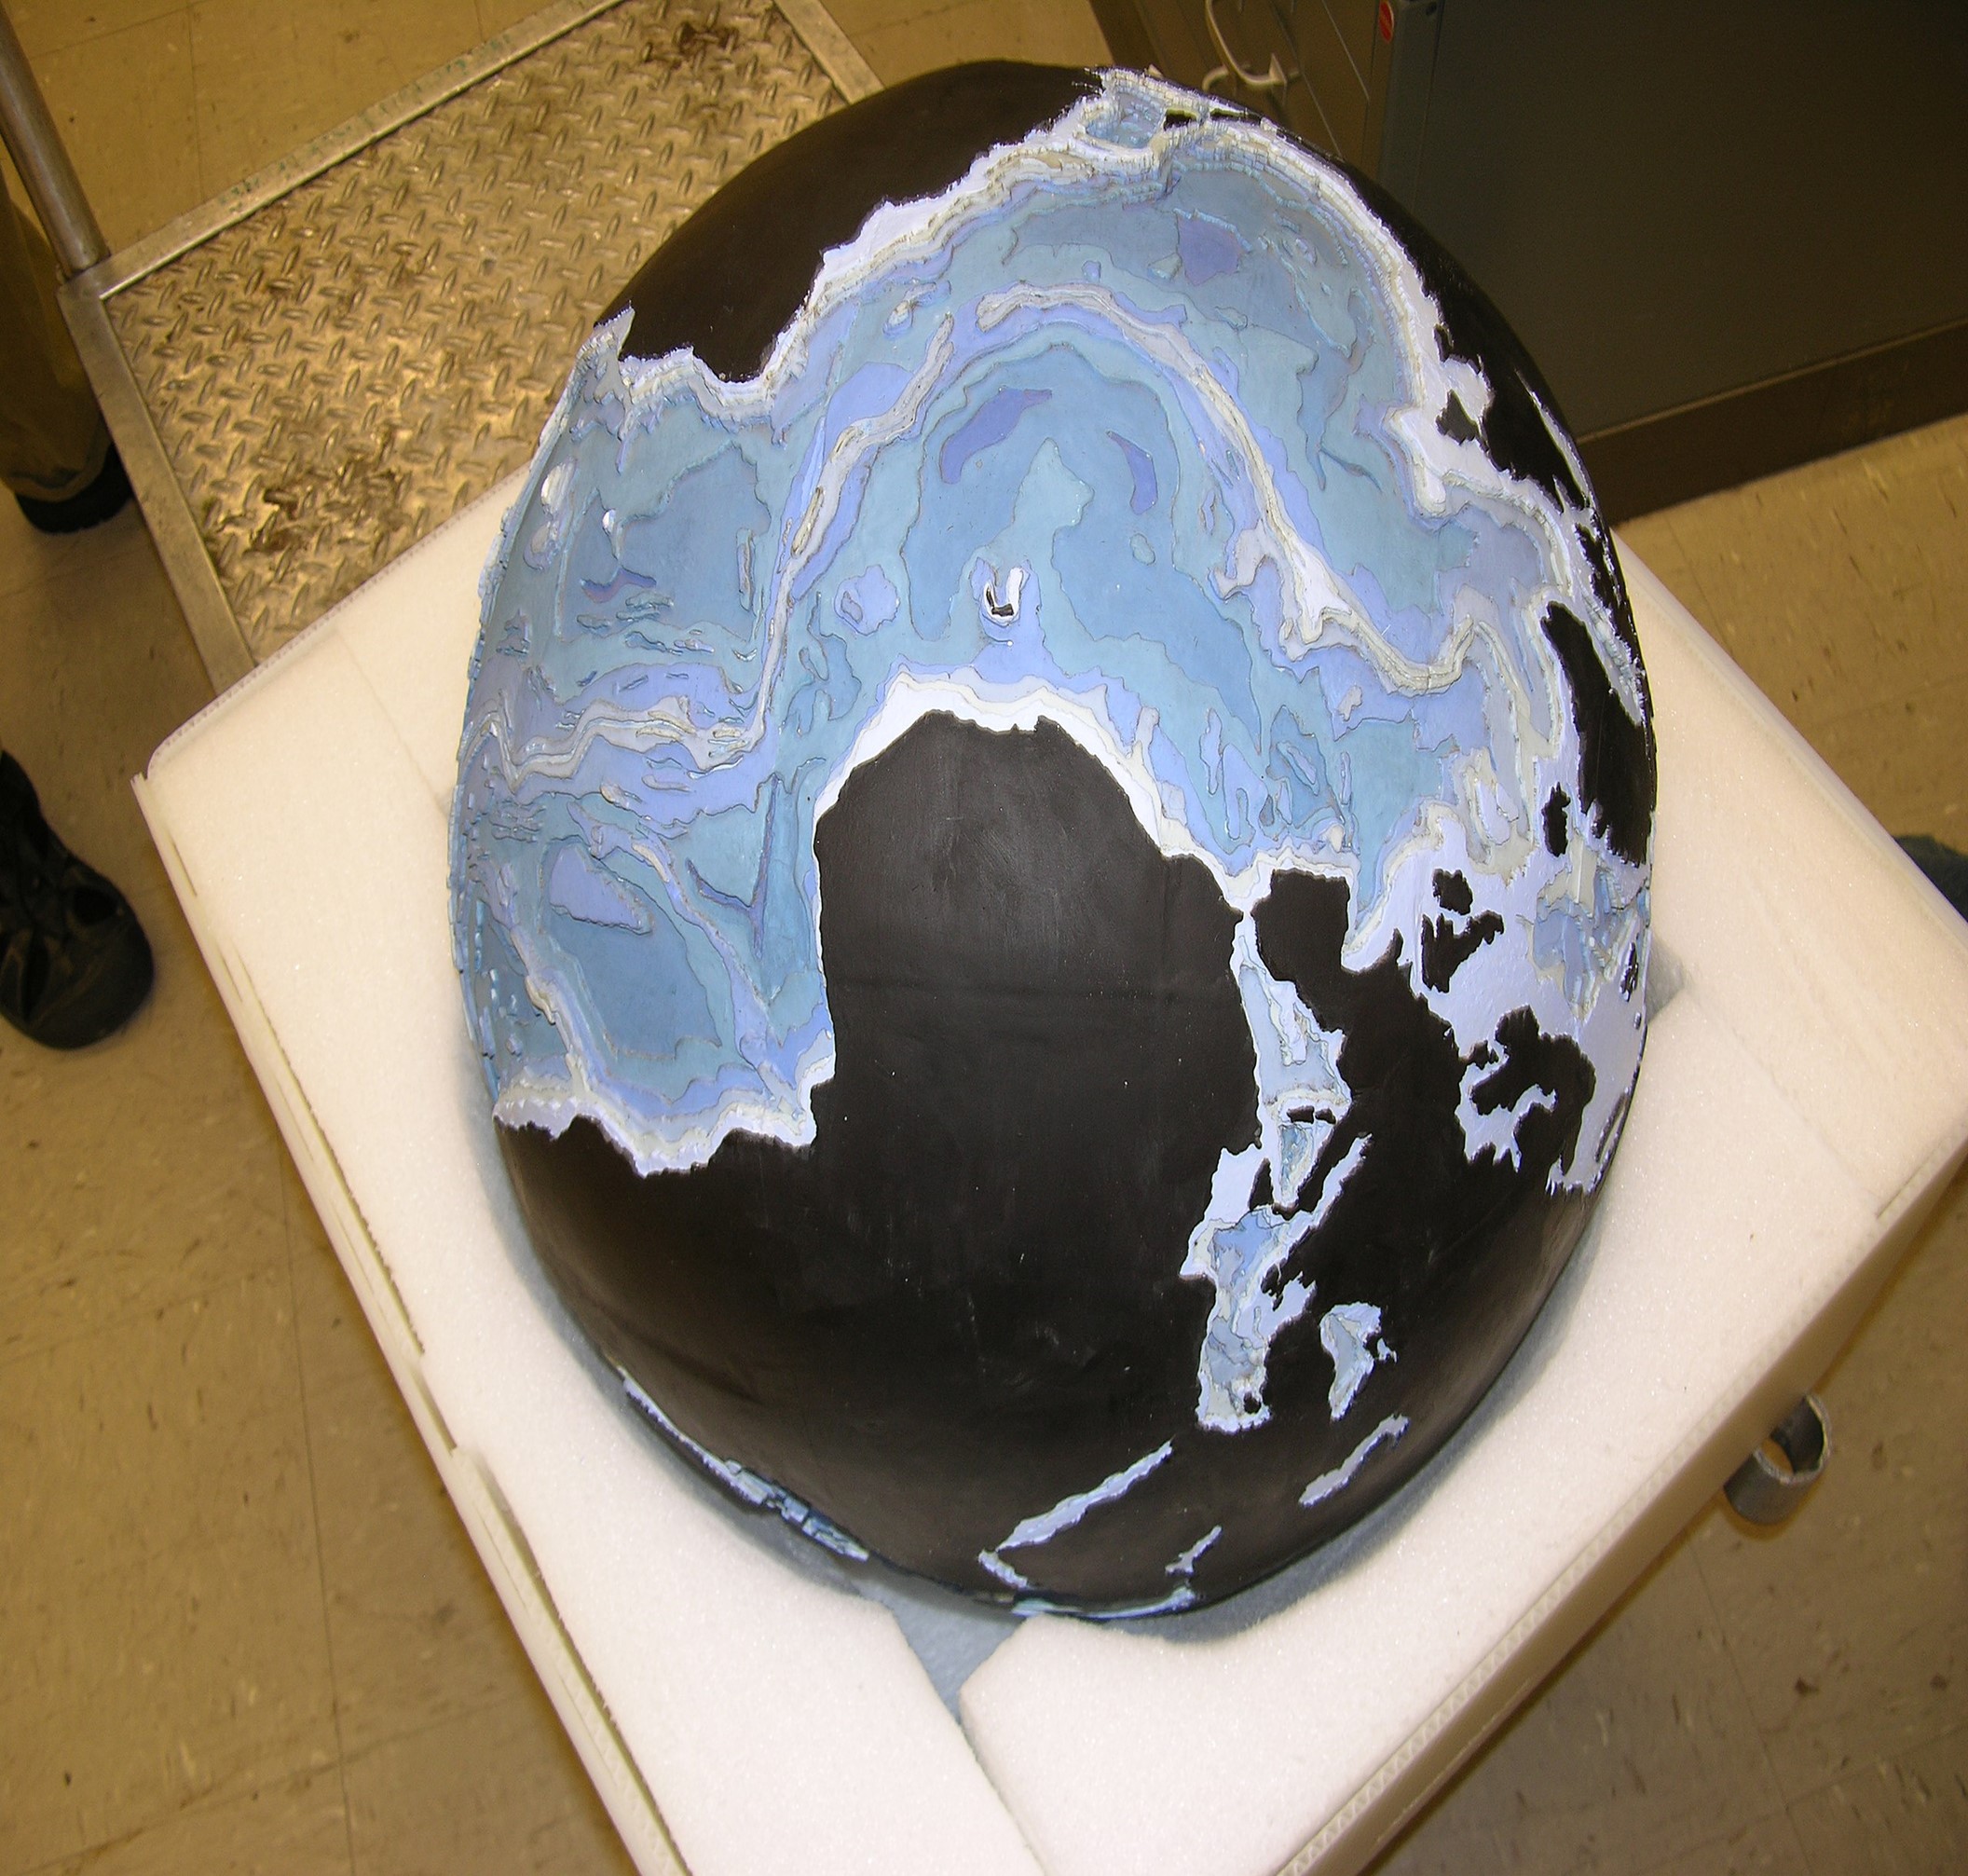
The famous basketball bathymetric globe was produced by Bruce Heezen and Marie Tharp in their quest to understand the physiography of the seafloor. The model now resides in the Library of Congress Geography and Map Division.
Credit: NOAA Photo Library, via Wikimedia Commons
- Faced with this corroborating data, in 1953, Bruce Heezen had to agree. Something was going on in the center of the Atlantic that needed to be explained. Did it continue around the globe? Was Earth expanding? (The idea of subduction zones came later in the 1960’s.)
- In 1956, Ewing and Heezen showed the results of the Lamont work at an American Geophysical Union meeting in Toronto. Reactions ranged from amazement to scorn.
- In 1959, skeptic Jacques Cousteau towed a camera across the ridge, revealing astonishing views of the rift valley that changed his mind.
- The mid-ocean ridge discovery was a revelation for geologists, but they still couldn’t explain it.
- Heezen and Ewing were at odds about the nature of the rift, leading to clashes that resulted in Bruce being threatened and Marie being fired by Dr. Ewing.
- Meanwhile, Marie kept working, even from home while being paid by the navy, reckoning that she would illustrate the rift for others, saying, “There's truth to the old cliché that a picture is worth a thousand words and that seeing is believing.” She plotted data and built maps for decades and finally got to go to sea in 1968.
- Princeton’s Harry Hess published his theory of seafloor spreading in his famous 1962 publication History of Ocean Basins, inspired after hearing a 1957 talk by Heezen about the “Great Global Rift.” This led to our modern understanding of plate tectonics.
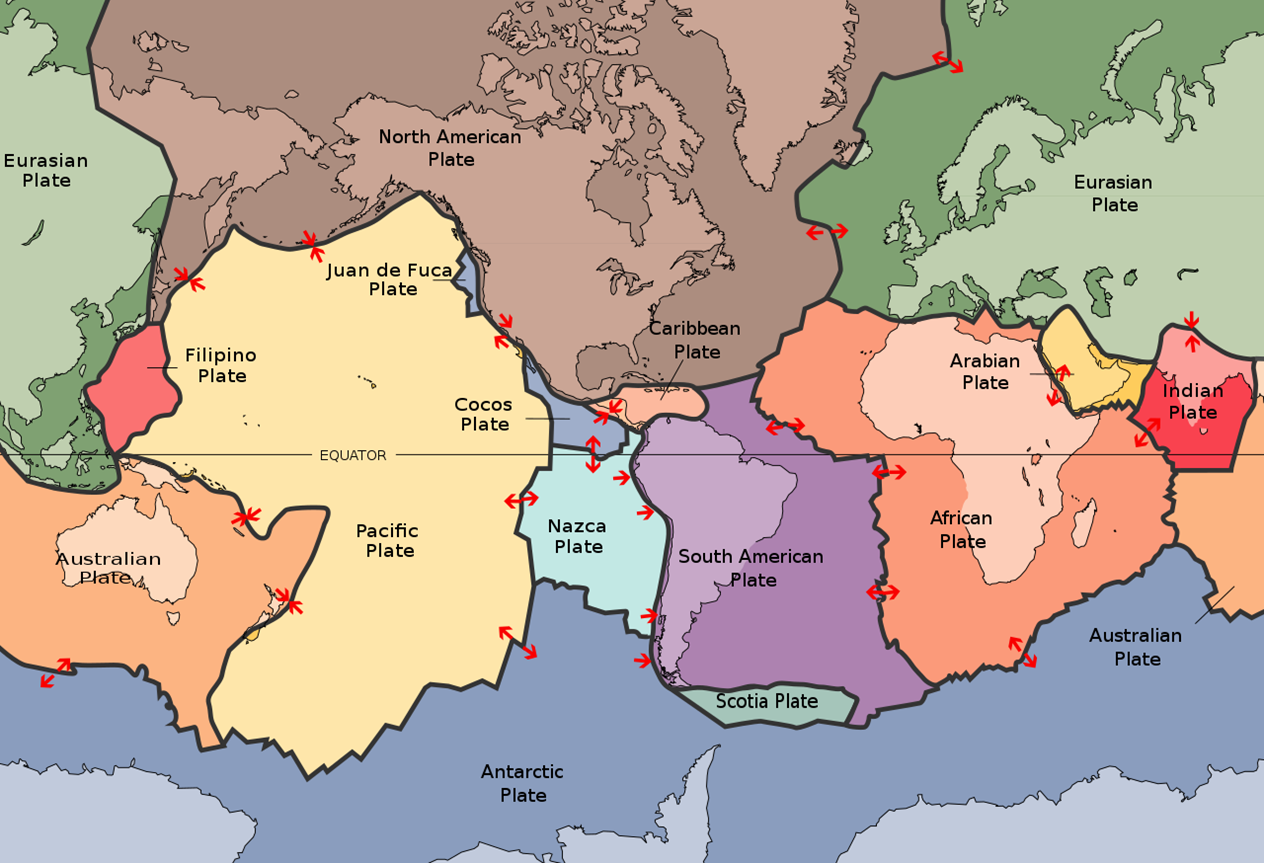
Map of Earth's principal tectonic plates. Rift margins are shown by arrows pointing away from plate boundaries.
Credit: Map:USGSDescription:Scott Nash, public domain, via Wikimedia Commons
- Marie translated the numerical details of the profiles into 3D sketches of ocean basins emptied of water using physiographic mapping techniques that employed shading and texture to express the topography of the seafloor.
- Where data was sparse, Marie had to imagine the bathymetry based on similar regions. Most of her guesswork extrapolations have stood the test of time.
- While detailed contour maps of seafloor bathymetry were classified by the U.S. Navy during the Cold War, less detailed physiographic maps were not, so the conceptual physiographic maps were made accessible to the public to help convey the magnitude of the discovery.
- In the late 1960’s, she and Dr. Heezen collaborated with Austrian painter Heinrich Berann to produce colored physiographic maps of the Indian Ocean in 1967 and the world ocean in 1977.
- A single print of the map was 42 in by 72 in, so only one printer in the United States could handle it at a cost of $40,000 per copy ($175,000 in today’s dollars).
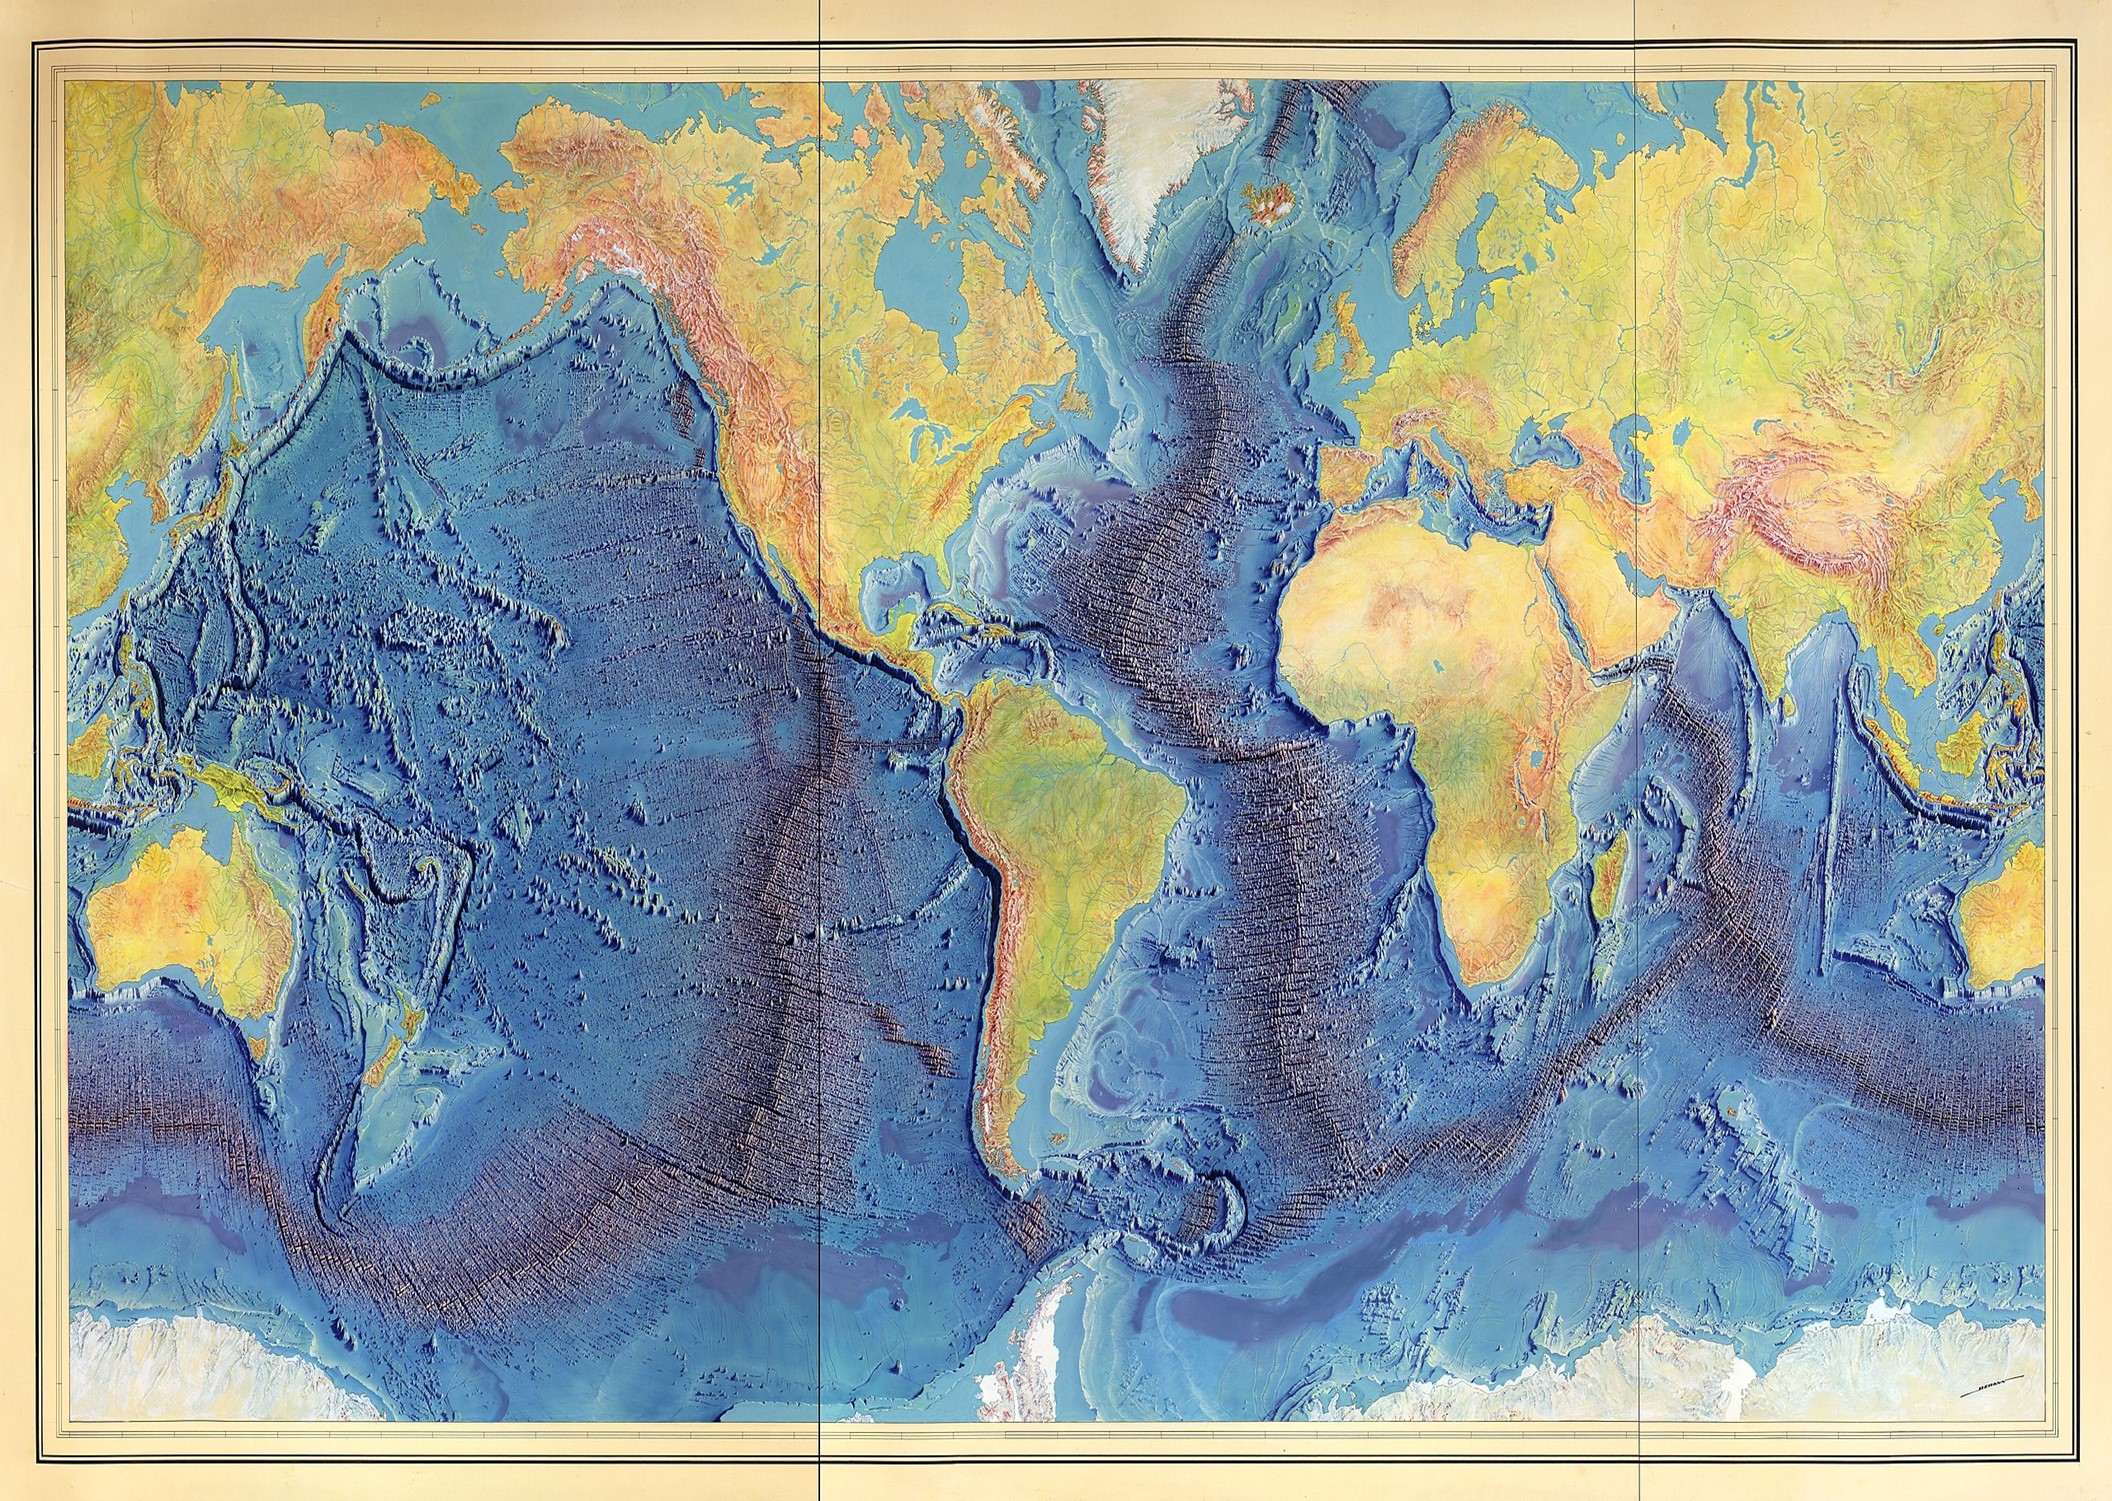
Marie Tharp and Bruce Heezen collaborated with painter Heinrich Berann on this world-famous painting of the Mid-Ocean Ridge and rift axis. It was published in 1977, making the discovery accessible to the general public.
Credit: Berann, Heinrich C., Heezen, Bruce C., Tharp, Marie., public domain, via Wikimedia Commons - Sadly, in 1977, Bruce Heezen died of a heart attack while exploring the ridge off Iceland in a nuclear submarine. It was just months before the publication of the world Map, ending an amazing 30-year collaboration that changed geology forever.
- In 1999, Marie Tharp reflected on the amazing opportunities offered by her assignment, especially as a woman.
- She said “The whole world was spread out before me (at least the 70% covered by oceans). I had a blank canvas to fill…an extraordinary jigsaw puzzle to piece together.” Using India ink, pens and rulers, she filled the canvas for us.
- She was still employed by Lamont when she died in 2006 at the age of 86.
- The oceans remain mysterious. Even today, maps of the moon and Mars are fifty times as detailed as maps of the ocean floor: ED-032 Our Unmapped Ocean.
To share Marie Tharp’s adventure with younger children, look for these books:
- Ocean Speaks: How Marie Tharp Revealed the Ocean's Biggest Secret by Jess Keating
- Solving the Puzzle Under the Sea: Marie Tharp Maps the Ocean Floor by Robert Burleigh